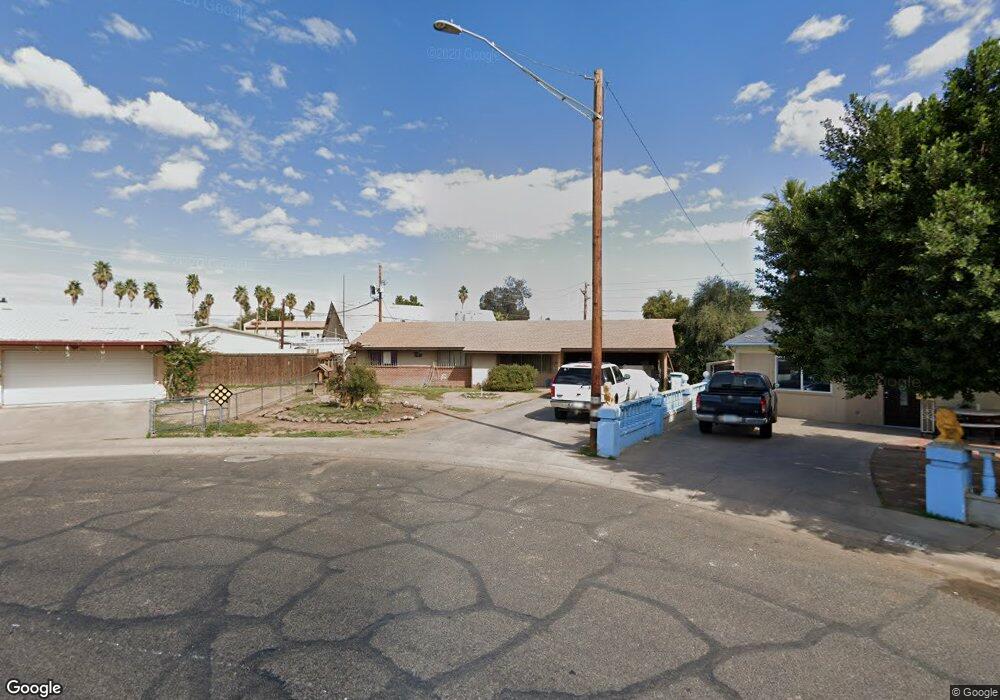
2535 N 51st Dr Phoenix, AZ 85035
Estimated Value: $286,831 - $390,000
--
Bed
2
Baths
1,747
Sq Ft
$196/Sq Ft
Est. Value
About This Home
This home is located at 2535 N 51st Dr, Phoenix, AZ 85035 and is currently estimated at $342,208, approximately $195 per square foot. 2535 N 51st Dr is a home located in Maricopa County with nearby schools including Justine Spitalny School, Cartwright School, and Maryvale High School.
Ownership History
Date
Name
Owned For
Owner Type
Purchase Details
Closed on
Aug 27, 1996
Sold by
Benge Cleo B
Bought by
Glover Rhonda J
Current Estimated Value
Home Financials for this Owner
Home Financials are based on the most recent Mortgage that was taken out on this home.
Original Mortgage
$61,963
Outstanding Balance
$5,335
Interest Rate
8.23%
Mortgage Type
FHA
Estimated Equity
$336,873
Purchase Details
Closed on
Jun 22, 1995
Sold by
Benge Cleo B
Bought by
Benge Cleo B
Home Financials for this Owner
Home Financials are based on the most recent Mortgage that was taken out on this home.
Original Mortgage
$43,000
Interest Rate
7.59%
Purchase Details
Closed on
May 22, 1995
Sold by
Benge Cleo B
Bought by
Benge Cleo B and The Cleo B Benge Living Trust
Home Financials for this Owner
Home Financials are based on the most recent Mortgage that was taken out on this home.
Original Mortgage
$43,000
Interest Rate
7.59%
Create a Home Valuation Report for This Property
The Home Valuation Report is an in-depth analysis detailing your home's value as well as a comparison with similar homes in the area
Home Values in the Area
Average Home Value in this Area
Purchase History
| Date | Buyer | Sale Price | Title Company |
|---|---|---|---|
| Glover Rhonda J | $62,000 | Security Title | |
| Benge Cleo B | -- | First Southwestern Title | |
| Benge Cleo B | -- | -- |
Source: Public Records
Mortgage History
| Date | Status | Borrower | Loan Amount |
|---|---|---|---|
| Open | Glover Rhonda J | $61,963 | |
| Previous Owner | Benge Cleo B | $43,000 |
Source: Public Records
Tax History Compared to Growth
Tax History
| Year | Tax Paid | Tax Assessment Tax Assessment Total Assessment is a certain percentage of the fair market value that is determined by local assessors to be the total taxable value of land and additions on the property. | Land | Improvement |
|---|---|---|---|---|
| 2025 | $2,023 | $13,045 | -- | -- |
| 2024 | $2,074 | $12,424 | -- | -- |
| 2023 | $2,074 | $25,060 | $5,010 | $20,050 |
| 2022 | $1,948 | $19,010 | $3,800 | $15,210 |
| 2021 | $1,988 | $16,980 | $3,390 | $13,590 |
| 2020 | $1,876 | $15,400 | $3,080 | $12,320 |
| 2019 | $1,791 | $13,520 | $2,700 | $10,820 |
| 2018 | $945 | $11,770 | $2,350 | $9,420 |
| 2017 | $901 | $9,780 | $1,950 | $7,830 |
| 2016 | $861 | $8,370 | $1,670 | $6,700 |
| 2015 | $794 | $7,200 | $1,440 | $5,760 |
Source: Public Records
Map
Nearby Homes
- 2544 N 52nd Ave
- 5149 W Lewis Ave
- 5159 W Vernon Ave
- 5039 W Vernon Ave
- 2538 N 53rd Dr
- 5243 W Vernon Ave
- 5301 W Vernon Ave
- 5336 W Lewis Ave
- 5201 W Monte Vista Rd
- 2907 N 53rd Ave
- 2511 N 48th Dr
- 5457 W Cambridge Ave
- 2512 N 47th Ln
- 4924 W Catalina Dr
- 2814 N 55th Ave
- 5147 W Earll Dr
- 2819 N 48th Ln
- 3025 N 53rd Dr
- 5539 W Wilshire Dr
- 4941 W Granada Rd
- 5124 W Virginia Ave
- 2533 N 51st Dr
- 2529 N 51st Dr
- 5134 W Virginia Ave
- 2534 N 51st Dr
- 2523 N 51st Dr
- 2528 N 51st Dr
- 5140 W Virginia Ave
- 5137 W Virginia Ave
- 2519 N 51st Dr
- 2524 N 51st Dr
- 5144 W Virginia Ave
- 2513 N 51st Dr
- 2518 N 51st Dr
- 5145 W Virginia Ave
- 5064 W Virginia Ave
- 5065 W Cambridge Ave
- 2515 N 51st Ln
- 5150 W Virginia Ave
- 2509 N 51st Dr