Estimated Value: $260,000 - $288,000
4
Beds
2
Baths
1,978
Sq Ft
$140/Sq Ft
Est. Value
About This Home
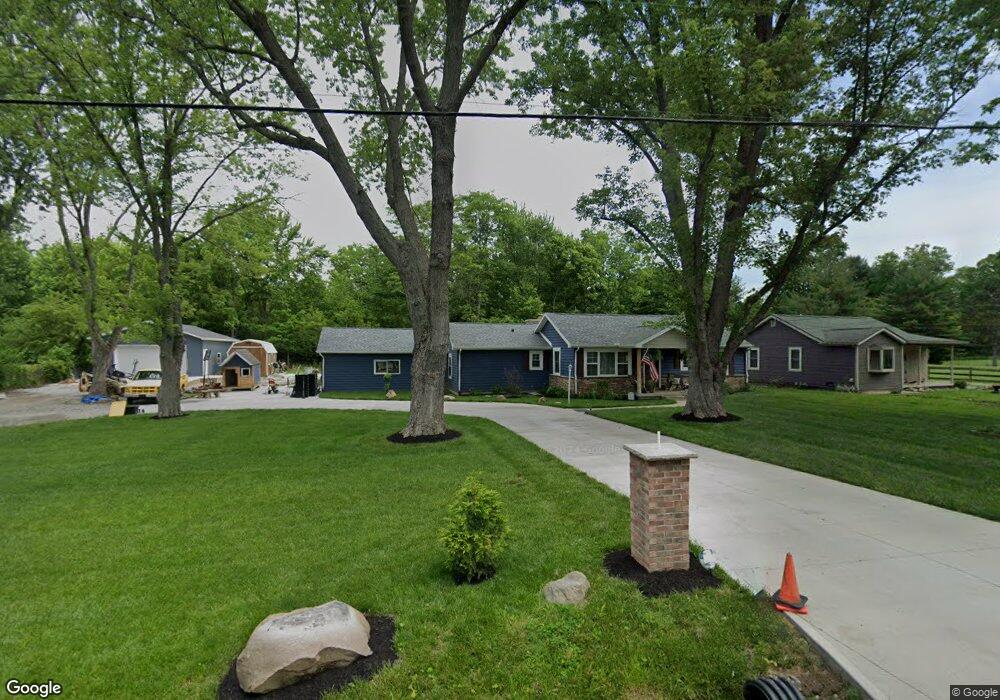
This home is located at 2537 Lefevre Rd, Troy, OH 45373 and is currently estimated at $275,934, approximately $139 per square foot. 2537 Lefevre Rd is a home located in Miami County with nearby schools including Miami East Elementary School, Miami East Junior High School, and Miami East High School.
Ownership History
Date
Name
Owned For
Owner Type
Purchase Details
Closed on
Nov 19, 2025
Sold by
Carters Complete Services Llc
Bought by
Carter Shane K and Carter Rachel
Current Estimated Value
Purchase Details
Closed on
Mar 23, 2021
Sold by
Carter Shane K and Carter Rachel
Bought by
Carters Complete Services Llc
Purchase Details
Closed on
Jun 19, 2020
Sold by
Mccuistion Derek
Bought by
Carter Shane K and Carter Rachel
Home Financials for this Owner
Home Financials are based on the most recent Mortgage that was taken out on this home.
Original Mortgage
$65,324
Interest Rate
3.2%
Mortgage Type
New Conventional
Purchase Details
Closed on
May 27, 2020
Sold by
Lauber Nancy L
Bought by
Mccuistion Derek
Home Financials for this Owner
Home Financials are based on the most recent Mortgage that was taken out on this home.
Original Mortgage
$65,324
Interest Rate
3.2%
Mortgage Type
New Conventional
Purchase Details
Closed on
Aug 1, 1984
Bought by
Lauber Nancy L
Create a Home Valuation Report for This Property
The Home Valuation Report is an in-depth analysis detailing your home's value as well as a comparison with similar homes in the area
Purchase History
| Date | Buyer | Sale Price | Title Company |
|---|---|---|---|
| Carter Shane K | -- | None Listed On Document | |
| Carters Complete Services Llc | -- | None Available | |
| Carters Complete Services Llc | -- | None Listed On Document | |
| Carter Shane K | $65,000 | None Available | |
| Mccuistion Derek | $55,000 | None Available | |
| Lauber Nancy L | -- | -- |
Source: Public Records
Mortgage History
| Date | Status | Borrower | Loan Amount |
|---|---|---|---|
| Previous Owner | Carter Shane K | $65,324 |
Source: Public Records
Tax History
| Year | Tax Paid | Tax Assessment Tax Assessment Total Assessment is a certain percentage of the fair market value that is determined by local assessors to be the total taxable value of land and additions on the property. | Land | Improvement |
|---|---|---|---|---|
| 2025 | $2,705 | $84,560 | $14,770 | $69,790 |
| 2024 | $2,705 | $59,080 | $12,530 | $46,550 |
| 2023 | $2,081 | $57,540 | $12,530 | $45,010 |
| 2022 | $2,036 | $56,320 | $12,530 | $43,790 |
| 2021 | $1,410 | $35,600 | $9,630 | $25,970 |
| 2020 | $1,019 | $35,600 | $9,630 | $25,970 |
| 2019 | $794 | $29,340 | $5,850 | $23,490 |
| 2018 | $713 | $26,850 | $4,450 | $22,400 |
| 2017 | $706 | $26,850 | $4,450 | $22,400 |
| 2016 | $664 | $26,850 | $4,450 | $22,400 |
| 2015 | $662 | $25,800 | $4,270 | $21,530 |
| 2014 | $662 | $25,800 | $4,270 | $21,530 |
| 2013 | $666 | $25,800 | $4,270 | $21,530 |
Source: Public Records
Map
Nearby Homes
- 1597 Old Staunton Rd
- 491 Mayfield Square E
- 984 Mystic Ln
- 916 Mystic Ln
- 1142 Lee Rd
- 1728 Hunters Ridge Dr
- 1482 Lee Rd
- 1334 Skylark Dr
- 1020 Crestview Dr
- 1424 Michael Dr
- 1400 Troy Urbana Rd
- 119 Morehead St
- 1210 Charleston Ct
- 1087 Fairfield Rd
- 1480 Maplecrest Dr
- 506 Michigan Ave
- 619 E Canal St
- 424 S Counts St
- 708 N Market St
- 996 Stony Brook Ln
- 2557 Lefevre Rd
- 2536 Lefevre Rd
- 2501 Lefevre Rd
- 2576 Lefevre Rd
- 2595 Lefevre Rd
- 2582 Lefevre Rd
- 2518 Lefevre Rd
- 2504 Lefevre Rd
- 2587 Lefevre Rd
- 2596 Lefevre Rd
- 2430 Lefevre Rd
- 2607 Lefevre Rd
- 2610 Lefevre Rd
- 2605 Lefevre Rd
- 2400 Lefevre Rd
- 2639 Lefevre Rd
- 2405 Lefevre Rd
- 2665 Lefevre Rd
- 2361 Lefevre Rd
- 300 N Sayers Rd
Your Personal Tour Guide
Ask me questions while you tour the home.