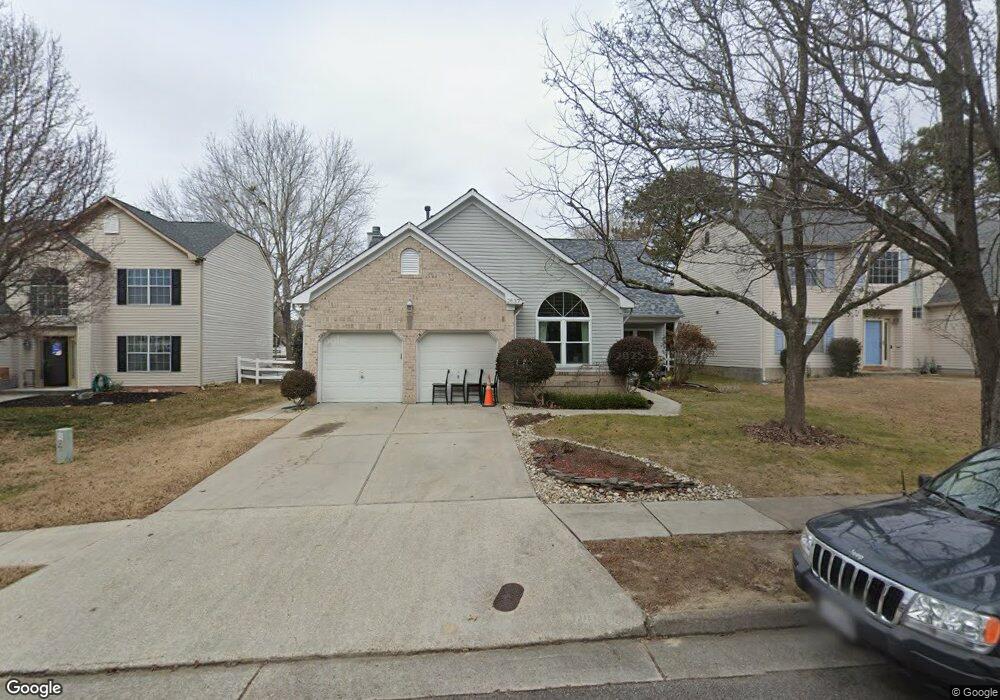
2537 Mulberry Loop Virginia Beach, VA 23456
Dam Neck NeighborhoodEstimated Value: $565,000 - $587,000
4
Beds
3
Baths
2,202
Sq Ft
$262/Sq Ft
Est. Value
About This Home
This home is located at 2537 Mulberry Loop, Virginia Beach, VA 23456 and is currently estimated at $577,863, approximately $262 per square foot. 2537 Mulberry Loop is a home located in Virginia Beach City with nearby schools including Strawbridge Elementary School, Corporate Landing Middle School, and Landstown High School.
Ownership History
Date
Name
Owned For
Owner Type
Purchase Details
Closed on
Aug 26, 2004
Sold by
Kim Chae S
Bought by
Gonzales Erik S
Current Estimated Value
Home Financials for this Owner
Home Financials are based on the most recent Mortgage that was taken out on this home.
Original Mortgage
$283,100
Outstanding Balance
$140,479
Interest Rate
6.01%
Mortgage Type
New Conventional
Estimated Equity
$437,384
Purchase Details
Closed on
Oct 25, 2001
Sold by
Larson Seth C
Bought by
Kim Chae S
Home Financials for this Owner
Home Financials are based on the most recent Mortgage that was taken out on this home.
Original Mortgage
$151,000
Interest Rate
6.82%
Purchase Details
Closed on
Dec 13, 1999
Sold by
Affordable Homes L L C I
Bought by
Larsan Seth C
Home Financials for this Owner
Home Financials are based on the most recent Mortgage that was taken out on this home.
Original Mortgage
$171,800
Interest Rate
7.71%
Create a Home Valuation Report for This Property
The Home Valuation Report is an in-depth analysis detailing your home's value as well as a comparison with similar homes in the area
Home Values in the Area
Average Home Value in this Area
Purchase History
| Date | Buyer | Sale Price | Title Company |
|---|---|---|---|
| Gonzales Erik S | $301,500 | -- | |
| Kim Chae S | $189,000 | -- | |
| Larsan Seth C | $166,811 | -- |
Source: Public Records
Mortgage History
| Date | Status | Borrower | Loan Amount |
|---|---|---|---|
| Open | Gonzales Erik S | $283,100 | |
| Previous Owner | Kim Chae S | $151,000 | |
| Previous Owner | Larsan Seth C | $171,800 |
Source: Public Records
Tax History
| Year | Tax Paid | Tax Assessment Tax Assessment Total Assessment is a certain percentage of the fair market value that is determined by local assessors to be the total taxable value of land and additions on the property. | Land | Improvement |
|---|---|---|---|---|
| 2025 | $4,902 | $515,500 | $195,000 | $320,500 |
| 2024 | $4,902 | $505,400 | $195,000 | $310,400 |
| 2023 | $4,587 | $463,300 | $180,000 | $283,300 |
| 2022 | $4,229 | $427,200 | $146,000 | $281,200 |
| 2021 | $3,863 | $390,200 | $133,000 | $257,200 |
| 2020 | $3,722 | $365,800 | $126,000 | $239,800 |
| 2019 | $3,698 | $348,400 | $117,000 | $231,400 |
| 2018 | $3,493 | $348,400 | $117,000 | $231,400 |
| 2017 | $3,382 | $337,400 | $112,500 | $224,900 |
| 2016 | $3,356 | $339,000 | $112,500 | $226,500 |
| 2015 | $3,395 | $342,900 | $116,400 | $226,500 |
| 2014 | $2,785 | $325,000 | $116,400 | $208,600 |
Source: Public Records
Map
Nearby Homes
- 1869 Somersby Ln
- 1892 Somersby Ln
- 2548 Farmworth Trail
- 1801 Winter Park Ct
- 1841 Kensal Green Dr
- 1905 Olympic Dr
- 2540 Windy Pines Bend
- 2736 Springhaven Dr
- 1725 Star Lake Dr
- 2485 Windy Pines Bend
- 2633 Au Sable Place
- 1700 Mayberry Dr
- 2304 Apple Tree Crescent
- 2404 Belle Ct
- 2817 Saville Garden Way
- 2937 Mimosa Ct
- 2436 Glenmore Hunt Trail
- 2212 Arklow Rd
- 1946 Cranborne Ct
- 2308 Holland Rd
- 2541 Mulberry Loop
- 2533 Mulberry Loop
- 2785 Mulberry Loop
- 2545 Mulberry Loop
- 2741 Mulberry Loop
- 2745 Mulberry Loop
- 2532 Mulberry Loop
- 2737 Mulberry Loop
- 2549 Mulberry Loop
- 2749 Mulberry Loop
- 2733 Mulberry Loop
- 2540 Mulberry Loop
- 2500 Mulberry Loop
- 2553 Mulberry Loop
- 2524 Mulberry Loop
- 2504 Mulberry Loop
- 2729 Mulberry Loop
- 2548 Mulberry Loop
- 2583 Mulberry Loop
- 2780 Mulberry Loop
Your Personal Tour Guide
Ask me questions while you tour the home.