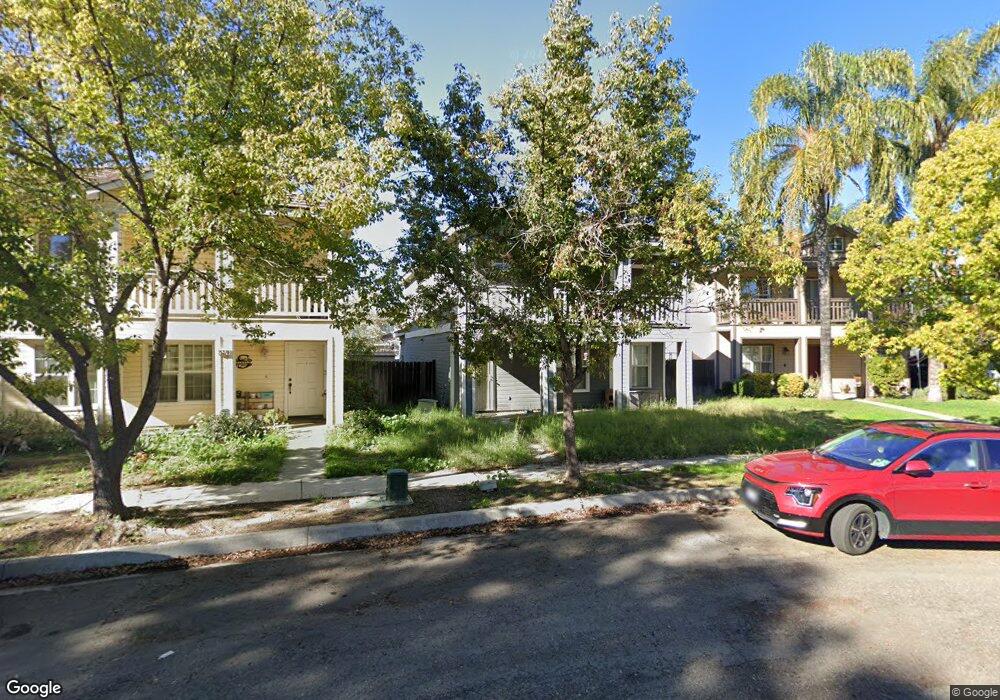
25372 Durango Loop Loma Linda, CA 92354
Estimated Value: $398,000 - $597,000
3
Beds
3
Baths
1,316
Sq Ft
$372/Sq Ft
Est. Value
About This Home
This home is located at 25372 Durango Loop, Loma Linda, CA 92354 and is currently estimated at $489,797, approximately $372 per square foot. 25372 Durango Loop is a home located in San Bernardino County with nearby schools including Mission Elementary School, Cope Middle School, and Redlands Senior High School.
Ownership History
Date
Name
Owned For
Owner Type
Purchase Details
Closed on
May 1, 2007
Sold by
Barton Tami Simons and Barton Brent
Bought by
Barton Tami and Barton Brent
Current Estimated Value
Purchase Details
Closed on
Jun 21, 2004
Sold by
Simons Tami and Grable Tami Lyn
Bought by
Simons Tami and Barton Brent
Home Financials for this Owner
Home Financials are based on the most recent Mortgage that was taken out on this home.
Original Mortgage
$110,000
Outstanding Balance
$51,487
Interest Rate
5.37%
Mortgage Type
Purchase Money Mortgage
Estimated Equity
$438,310
Purchase Details
Closed on
Sep 17, 2003
Sold by
Grable Ken Gilbert
Bought by
Grable Tami Lynn
Purchase Details
Closed on
Jan 16, 2002
Sold by
Gardner Construction & Development Inc
Bought by
Grable Kenneth G and Grable Tami L
Home Financials for this Owner
Home Financials are based on the most recent Mortgage that was taken out on this home.
Original Mortgage
$107,843
Interest Rate
6.87%
Mortgage Type
FHA
Create a Home Valuation Report for This Property
The Home Valuation Report is an in-depth analysis detailing your home's value as well as a comparison with similar homes in the area
Home Values in the Area
Average Home Value in this Area
Purchase History
| Date | Buyer | Sale Price | Title Company |
|---|---|---|---|
| Barton Tami | -- | None Available | |
| Simons Tami | -- | Fidelity National Title Co | |
| Grable Tami Lynn | -- | -- | |
| Grable Kenneth G | $110,000 | First American Title Ins Co |
Source: Public Records
Mortgage History
| Date | Status | Borrower | Loan Amount |
|---|---|---|---|
| Open | Simons Tami | $110,000 | |
| Previous Owner | Grable Kenneth G | $107,843 |
Source: Public Records
Tax History
| Year | Tax Paid | Tax Assessment Tax Assessment Total Assessment is a certain percentage of the fair market value that is determined by local assessors to be the total taxable value of land and additions on the property. | Land | Improvement |
|---|---|---|---|---|
| 2025 | $2,777 | $162,358 | $40,590 | $121,768 |
| 2024 | $2,627 | $159,174 | $39,794 | $119,380 |
| 2023 | $2,591 | $156,053 | $39,014 | $117,039 |
| 2022 | $2,531 | $152,993 | $38,249 | $114,744 |
| 2021 | $2,497 | $149,993 | $37,499 | $112,494 |
| 2020 | $2,447 | $148,455 | $37,114 | $111,341 |
| 2019 | $2,365 | $145,544 | $36,386 | $109,158 |
| 2018 | $2,320 | $142,691 | $35,673 | $107,018 |
| 2017 | $2,282 | $139,894 | $34,974 | $104,920 |
| 2016 | $2,197 | $137,151 | $34,288 | $102,863 |
| 2015 | $2,183 | $135,091 | $33,773 | $101,318 |
| 2014 | $2,152 | $132,444 | $33,111 | $99,333 |
Source: Public Records
Map
Nearby Homes
- 10679 Seamont Dr
- 25446 Lane St
- 25544 Portola Loop
- 10733 Mead Ct
- 25549 Prospect Ave
- 10624 Coloma St
- 25675 Prospect Ave
- 11363 Poplar St
- 11640 Richardson St
- 10655 Mountain View Ave
- 11430 Benton St
- 24976 Barton Rd
- 11477 Benton St
- 11473 Benton St
- 25358 Lawton Ave
- 25338 Lawton Ave
- 25893 Amapolas St
- 25526 Redlands Blvd Unit 101
- 25526 Redlands Blvd Unit 157
- 25736 Sunrise Way
- 25370 Durango Loop
- 25376 Durango Loop
- 25368 Durango Loop
- 10946 Cabrillo Loop
- 10942 Cabrillo Loop
- 25380 Durango Loop
- 10950 Cabrillo Loop
- 10938 Cabrillo Loop
- 25384 Durango Loop
- 25388 Durango Loop
- 10934 Cabrillo Loop
- 25392 Durango Loop
- 10954 Cabrillo Loop
- 10930 Cabrillo Loop
- 25396 Durango Loop
- 10956 Cabrillo Loop
- 25400 Durango Loop
- 10926 Cabrillo Loop
- 10958 Cabrillo Loop
- 10922 Cabrillo Loop
Your Personal Tour Guide
Ask me questions while you tour the home.