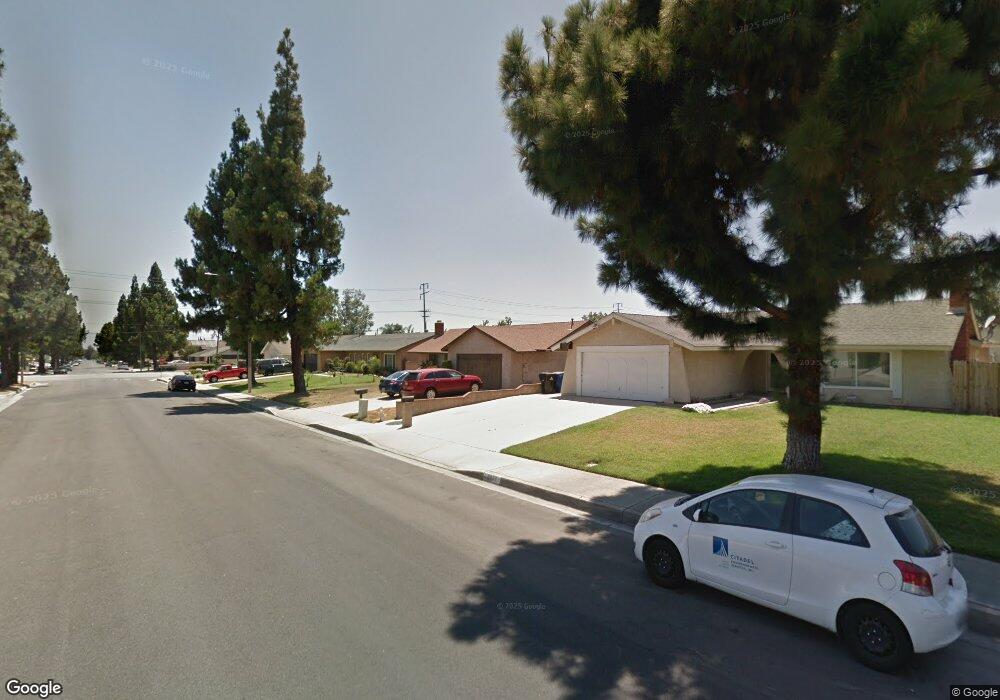
2538 S Cucamonga Ave Ontario, CA 91761
Downtown Ontario NeighborhoodEstimated Value: $668,783 - $743,000
4
Beds
2
Baths
1,444
Sq Ft
$495/Sq Ft
Est. Value
About This Home
This home is located at 2538 S Cucamonga Ave, Ontario, CA 91761 and is currently estimated at $714,196, approximately $494 per square foot. 2538 S Cucamonga Ave is a home located in San Bernardino County with nearby schools including Bon View Elementary, De Anza Middle, and Ontario High School.
Ownership History
Date
Name
Owned For
Owner Type
Purchase Details
Closed on
Apr 18, 2006
Sold by
Gods Country Rentals Llc and Barney Timothy Dwight
Bought by
Pine Knot Properties Llc
Current Estimated Value
Purchase Details
Closed on
Feb 13, 2004
Sold by
Hammond Terry and Hammond Doreen J
Bought by
Barney Timothy Dwight and Barney Lori Clare
Home Financials for this Owner
Home Financials are based on the most recent Mortgage that was taken out on this home.
Original Mortgage
$9,500
Interest Rate
5.64%
Mortgage Type
Seller Take Back
Purchase Details
Closed on
May 14, 2003
Sold by
Gamboa Frank C
Bought by
Gamboa Frank C and Gamboa Martha J
Purchase Details
Closed on
Oct 3, 2001
Sold by
Abril Carolyn J
Bought by
Gamboa Frank C
Purchase Details
Closed on
Nov 15, 1998
Sold by
Vijay Arora and Arora Madhu Tr
Bought by
Arora Vijay and Arora Madhu
Create a Home Valuation Report for This Property
The Home Valuation Report is an in-depth analysis detailing your home's value as well as a comparison with similar homes in the area
Home Values in the Area
Average Home Value in this Area
Purchase History
| Date | Buyer | Sale Price | Title Company |
|---|---|---|---|
| Pine Knot Properties Llc | -- | None Available | |
| Barney Timothy Dwight | $13,500 | First American | |
| Gamboa Frank C | -- | -- | |
| Gamboa Frank C | $10,000 | Commonwealth Land Title Co | |
| Arora Vijay | -- | -- |
Source: Public Records
Mortgage History
| Date | Status | Borrower | Loan Amount |
|---|---|---|---|
| Previous Owner | Barney Timothy Dwight | $9,500 |
Source: Public Records
Tax History Compared to Growth
Tax History
| Year | Tax Paid | Tax Assessment Tax Assessment Total Assessment is a certain percentage of the fair market value that is determined by local assessors to be the total taxable value of land and additions on the property. | Land | Improvement |
|---|---|---|---|---|
| 2025 | $1,320 | $123,930 | $27,174 | $96,756 |
| 2024 | $1,320 | $121,500 | $26,641 | $94,859 |
| 2023 | $1,284 | $119,118 | $26,119 | $92,999 |
| 2022 | $1,266 | $116,782 | $25,607 | $91,175 |
| 2021 | $1,257 | $114,492 | $25,105 | $89,387 |
| 2020 | $1,235 | $113,318 | $24,848 | $88,470 |
| 2019 | $1,224 | $111,096 | $24,361 | $86,735 |
| 2018 | $1,206 | $108,917 | $23,883 | $85,034 |
| 2017 | $1,163 | $106,782 | $23,415 | $83,367 |
| 2016 | $1,118 | $104,688 | $22,956 | $81,732 |
| 2015 | $1,110 | $103,115 | $22,611 | $80,504 |
| 2014 | $1,077 | $101,095 | $22,168 | $78,927 |
Source: Public Records
Map
Nearby Homes
- 2437 S Garfield Place
- 1020 E Tam o Shanter Ct
- 2453 S Marigold Place
- 2708 S Parkside Dr
- 4235 S Gasly Paseo
- 0 Vineyard Unit CV25067044
- 4245 S Grasly Paseo
- 4233 S Grasly Paseo
- 0 Phillips Unit CV23180894
- 2408 S Taylor Place
- 2413 S Parco Ave
- 2919 S Caldwell Ave
- 2718 S Sandpiper Ave
- 2535 S Imperial Place
- 2119 S Phoenix Place
- 2424 S Lake Ave
- 513 E Fairfield Ct
- 1456 E Philadelphia St Unit 134
- 1456 E Philadelphia St Unit 378
- 1456 E Philadelphia St
- 2532 S Cucamonga Ave
- 2544 S Cucamonga Ave
- 2533 S Holmes Place
- 2539 S Holmes Place
- 2527 S Holmes Place
- 2550 S Cucamonga Ave
- 2533 S Cucamonga Ave
- 2521 S Holmes Place
- 2545 S Holmes Place
- 2527 S Cucamonga Ave
- 1102 E Cherry Hill St
- 2520 S Cucamonga Ave
- 2521 S Cucamonga Ave
- 2515 S Holmes Place
- 1108 E Cherry Hill St
- 2538 S Holmes Place
- 2534 S Raymond Place
- 2532 S Holmes Place
- 2544 S Holmes Place
- 2528 S Raymond Place