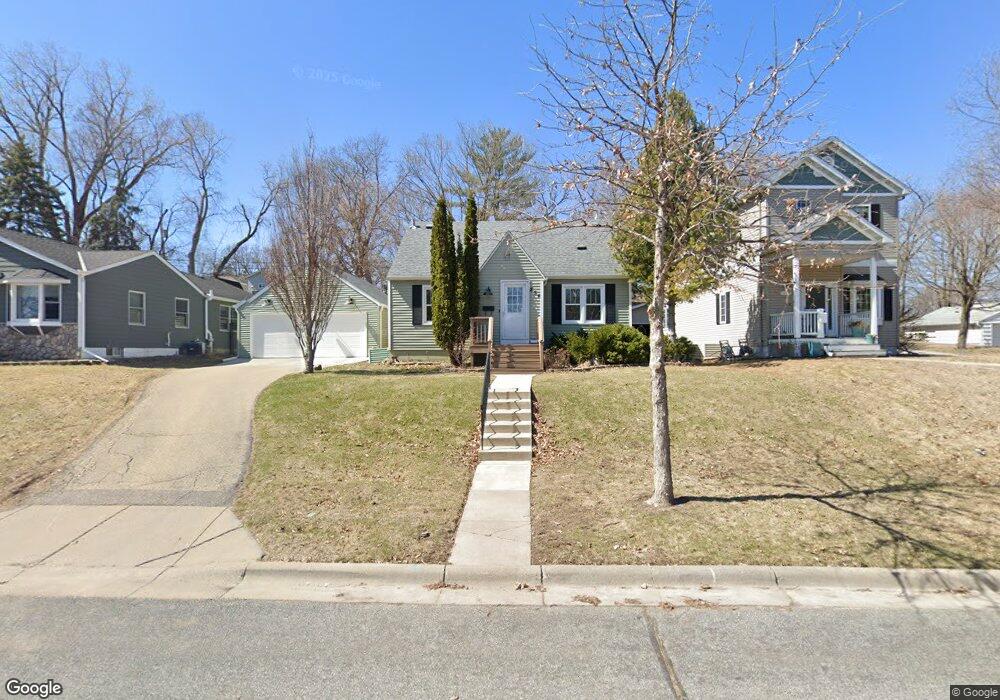
254 19th Ave N Hopkins, MN 55343
Avenues West NeighborhoodEstimated Value: $329,000 - $377,368
3
Beds
1
Bath
1,131
Sq Ft
$310/Sq Ft
Est. Value
About This Home
This home is located at 254 19th Ave N, Hopkins, MN 55343 and is currently estimated at $350,842, approximately $310 per square foot. 254 19th Ave N is a home located in Hennepin County with nearby schools including Eisenhower Elementary School, Hopkins West Junior High School, and Hopkins Senior High School.
Ownership History
Date
Name
Owned For
Owner Type
Purchase Details
Closed on
Jun 24, 2016
Sold by
Montoya Nicolas E and Montoya Angela Marie
Bought by
Schepers Samuel D and Schepers Emily M
Current Estimated Value
Home Financials for this Owner
Home Financials are based on the most recent Mortgage that was taken out on this home.
Original Mortgage
$199,500
Outstanding Balance
$158,832
Interest Rate
3.58%
Mortgage Type
New Conventional
Estimated Equity
$192,010
Purchase Details
Closed on
Jul 28, 2011
Sold by
Federal National Mortgage Association
Bought by
Montoya Nicolas E
Home Financials for this Owner
Home Financials are based on the most recent Mortgage that was taken out on this home.
Original Mortgage
$125,600
Interest Rate
4.54%
Mortgage Type
New Conventional
Purchase Details
Closed on
Jul 21, 2010
Sold by
Dicker Stefanie
Bought by
Wells Fargo Bank Na
Purchase Details
Closed on
Jan 15, 2004
Sold by
Hilbelink Mike and Hilbelink Ann
Bought by
Dicker Jonah N and Dicker Stefanie L
Purchase Details
Closed on
Jul 15, 2003
Sold by
Hornig James A and Hornig Sally K
Bought by
Hilbelink Michael J
Purchase Details
Closed on
Mar 6, 2003
Sold by
Themmes Gary Joseph
Bought by
Hornig James A
Create a Home Valuation Report for This Property
The Home Valuation Report is an in-depth analysis detailing your home's value as well as a comparison with similar homes in the area
Home Values in the Area
Average Home Value in this Area
Purchase History
| Date | Buyer | Sale Price | Title Company |
|---|---|---|---|
| Schepers Samuel D | $210,000 | None Available | |
| Montoya Nicolas E | -- | Title One Inc | |
| Montoya Nicholas E | $129,500 | -- | |
| Wells Fargo Bank Na | $213,112 | -- | |
| Dicker Jonah N | $204,500 | -- | |
| Hilbelink Michael J | $143,500 | -- | |
| Hornig James A | $130,000 | -- |
Source: Public Records
Mortgage History
| Date | Status | Borrower | Loan Amount |
|---|---|---|---|
| Open | Schepers Samuel D | $199,500 | |
| Previous Owner | Montoya Nicolas E | $125,600 |
Source: Public Records
Tax History Compared to Growth
Tax History
| Year | Tax Paid | Tax Assessment Tax Assessment Total Assessment is a certain percentage of the fair market value that is determined by local assessors to be the total taxable value of land and additions on the property. | Land | Improvement |
|---|---|---|---|---|
| 2024 | $5,084 | $356,100 | $172,700 | $183,400 |
| 2023 | $4,944 | $347,000 | $161,700 | $185,300 |
| 2022 | $4,350 | $349,000 | $168,000 | $181,000 |
| 2021 | $3,892 | $290,000 | $143,000 | $147,000 |
| 2020 | $3,850 | $262,000 | $122,000 | $140,000 |
| 2019 | $3,377 | $247,000 | $119,000 | $128,000 |
| 2018 | $3,162 | $220,000 | $96,000 | $124,000 |
| 2017 | $2,775 | $188,000 | $87,000 | $101,000 |
| 2016 | $3,494 | $175,000 | $81,000 | $94,000 |
| 2015 | $3,190 | $175,000 | $81,000 | $94,000 |
| 2014 | -- | $147,000 | $68,000 | $79,000 |
Source: Public Records
Map
Nearby Homes
- 37 19th Ave N
- 102 16th Ave N
- 329 & 327 16th Ave N
- 3930 Cottage Ln
- 11908 James Rd
- 2062 Mainstreet
- 11416 Minnetonka Mills Rd
- 228 12th Ave N
- 1502 5th St N Unit 403
- 1502 5th St N Unit 211
- 130 17th Ave S
- 12209 Woodbine Rd
- 4006 Huntingdon Dr
- 32 11th Ave S Unit 303
- 32 11th Ave S Unit 204
- 32 11th Ave S Unit 305
- 334 9th Ave N
- 4717 Karen Cir
- 3656 Robin Ln
- 4532 Fairview Ave
- 258 19th Ave N
- 244 19th Ave N
- 238 19th Ave N
- 245 20th Ave N
- 251 20th Ave N
- 302 19th Ave N
- 241 20th Ave N
- 249 249 19th-Avenue-n
- 249 19th Ave N
- 257 19th Ave N
- 235 20th Ave N
- 245 19th Ave N
- 301 20th Ave N
- 226 19th Ave N
- 310 19th Ave N
- 231 20th Ave N
- 235 19th Ave N
- 301 19th Ave N
- 231 19th Ave N
- 224 19th Ave N