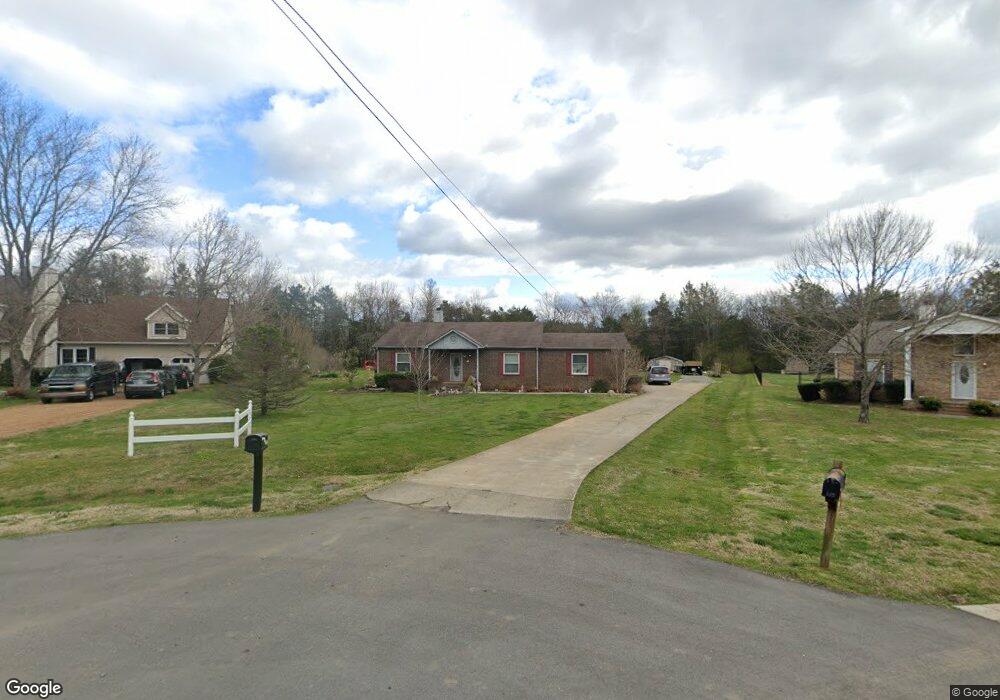
254 Antique Ave Smyrna, TN 37167
Estimated Value: $395,000 - $422,791
--
Bed
2
Baths
1,640
Sq Ft
$249/Sq Ft
Est. Value
About This Home
This home is located at 254 Antique Ave, Smyrna, TN 37167 and is currently estimated at $408,448, approximately $249 per square foot. 254 Antique Ave is a home located in Rutherford County with nearby schools including Stewarts Creek Elementary School, Stewarts Creek Middle School, and Stewarts Creek High School.
Ownership History
Date
Name
Owned For
Owner Type
Purchase Details
Closed on
Nov 8, 2011
Sold by
Butler Jerry Construction
Bought by
Gallegos Jose L and Martinez Norma I
Current Estimated Value
Home Financials for this Owner
Home Financials are based on the most recent Mortgage that was taken out on this home.
Original Mortgage
$141,734
Outstanding Balance
$97,346
Interest Rate
4.17%
Mortgage Type
Commercial
Estimated Equity
$311,102
Purchase Details
Closed on
Aug 11, 2011
Sold by
Marchiori Albert Duane
Bought by
Butler Jerry Construction Inc
Purchase Details
Closed on
Aug 13, 2001
Sold by
Carbine Devl Co
Bought by
Marchioro Albert D
Home Financials for this Owner
Home Financials are based on the most recent Mortgage that was taken out on this home.
Original Mortgage
$85,003
Interest Rate
7.1%
Purchase Details
Closed on
Jan 9, 1996
Sold by
Carbine and Barbara
Bought by
Carbine Development Co
Create a Home Valuation Report for This Property
The Home Valuation Report is an in-depth analysis detailing your home's value as well as a comparison with similar homes in the area
Home Values in the Area
Average Home Value in this Area
Purchase History
| Date | Buyer | Sale Price | Title Company |
|---|---|---|---|
| Gallegos Jose L | $138,900 | -- | |
| Butler Jerry Construction Inc | $75,900 | -- | |
| Marchioro Albert D | -- | -- | |
| Carbine Development Co | $177,311 | -- |
Source: Public Records
Mortgage History
| Date | Status | Borrower | Loan Amount |
|---|---|---|---|
| Open | Gallegos Jose L | $141,734 | |
| Previous Owner | Carbine Development Co | $85,003 |
Source: Public Records
Tax History Compared to Growth
Tax History
| Year | Tax Paid | Tax Assessment Tax Assessment Total Assessment is a certain percentage of the fair market value that is determined by local assessors to be the total taxable value of land and additions on the property. | Land | Improvement |
|---|---|---|---|---|
| 2025 | $1,455 | $77,525 | $15,825 | $61,700 |
| 2024 | $1,455 | $77,525 | $15,825 | $61,700 |
| 2023 | $1,455 | $77,525 | $15,825 | $61,700 |
| 2022 | $1,253 | $77,525 | $15,825 | $61,700 |
| 2021 | $1,160 | $52,250 | $12,500 | $39,750 |
| 2020 | $1,160 | $52,250 | $12,500 | $39,750 |
| 2019 | $1,160 | $52,250 | $12,500 | $39,750 |
| 2018 | $1,097 | $52,250 | $0 | $0 |
| 2017 | $1,021 | $38,100 | $0 | $0 |
| 2016 | $1,021 | $38,100 | $0 | $0 |
| 2015 | $1,021 | $38,100 | $0 | $0 |
| 2014 | $947 | $38,100 | $0 | $0 |
| 2013 | -- | $35,725 | $0 | $0 |
Source: Public Records
Map
Nearby Homes
- 4211 Almaville Rd
- 6816 Springwater St
- 4713 Waterlook Way
- 7023 Springwater St
- 708 Amberton Dr
- 111 Fire Oak Ct
- 802 Carnation Dr
- 7116 Springwater St
- 980 Horseshoe Dr
- 833 Clematis Dr
- 4928 Elmview Ct
- Hartwell C Plan at Clear Creek
- Highland IA Plan at Clear Creek
- Harpeth D Plan at Clear Creek
- Norris Farmhouse Plan at Clear Creek
- Sonoma A Plan at Clear Creek
- Harpeth C Plan at Clear Creek
- 7318 Winners Rd
- 903 Carnation Dr
- 222 Wellington Way
- 250 Antique Ave
- 266 Antique Ave
- 298 Antique Ave
- 324 Antique Ave
- 6699 Almaville Rd
- 363 Antique Ave
- 3926 Almaville Rd
- 253 Inez Dr
- 140 Century Ct
- 423 Antique Ave
- 185 Inez Dr
- 34 Century Ct
- 35 Century Ct
- 4203 Almaville Rd
- 4204 Almaville Rd
- 351 Inez Dr
- 37 Century Ct
- 3995 Almaville Rd Unit 3999
- 136 Century Ct
- 1002 Idealist Ct