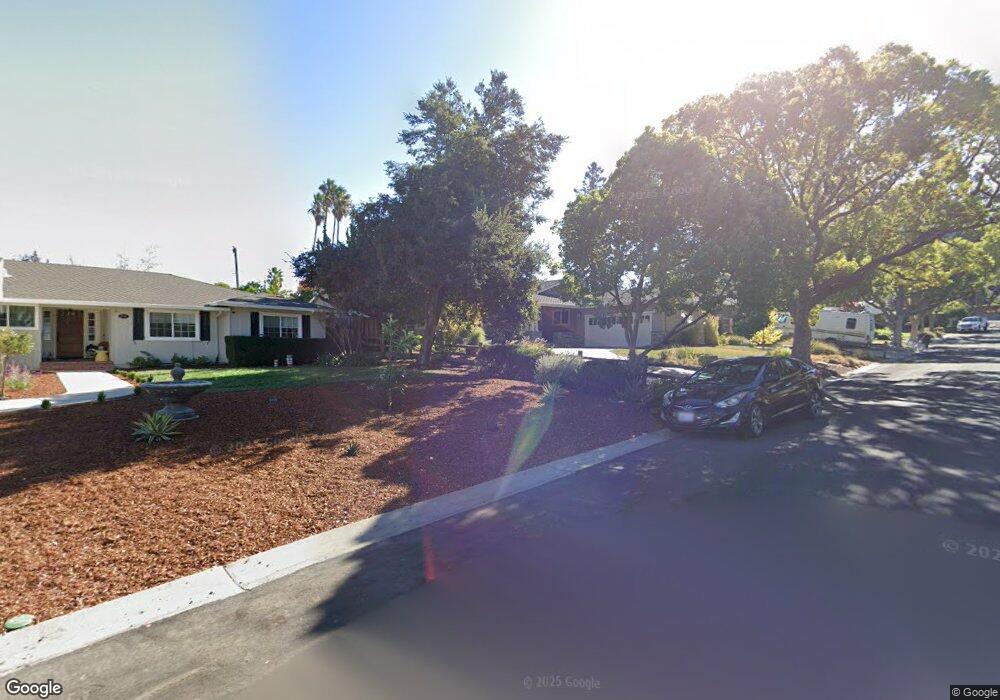
254 Belvue Dr Los Gatos, CA 95032
De Voss-Leigh NeighborhoodEstimated Value: $3,181,141 - $3,274,000
3
Beds
3
Baths
2,640
Sq Ft
$1,228/Sq Ft
Est. Value
About This Home
This home is located at 254 Belvue Dr, Los Gatos, CA 95032 and is currently estimated at $3,242,035, approximately $1,228 per square foot. 254 Belvue Dr is a home located in Santa Clara County with nearby schools including Noddin Elementary School, Union Middle School, and Leigh High School.
Ownership History
Date
Name
Owned For
Owner Type
Purchase Details
Closed on
May 30, 2007
Sold by
Hutchins Darren and Hutchins Suzanne S
Bought by
Hutchins Darren M and Hutchins Suzanne S
Current Estimated Value
Purchase Details
Closed on
Jun 8, 2004
Sold by
Naimi Ramin and Rashed Azita
Bought by
Hutchins Darren and Hutchins Suzanne S
Home Financials for this Owner
Home Financials are based on the most recent Mortgage that was taken out on this home.
Original Mortgage
$930,000
Outstanding Balance
$457,361
Interest Rate
6.09%
Mortgage Type
Purchase Money Mortgage
Estimated Equity
$2,784,674
Purchase Details
Closed on
Dec 10, 1999
Sold by
Colla Gregory D and Colla Vicki L
Bought by
Naimi Ramin and Rashed Azita
Home Financials for this Owner
Home Financials are based on the most recent Mortgage that was taken out on this home.
Original Mortgage
$580,000
Interest Rate
7.25%
Create a Home Valuation Report for This Property
The Home Valuation Report is an in-depth analysis detailing your home's value as well as a comparison with similar homes in the area
Home Values in the Area
Average Home Value in this Area
Purchase History
| Date | Buyer | Sale Price | Title Company |
|---|---|---|---|
| Hutchins Darren M | -- | None Available | |
| Hutchins Darren | $1,180,000 | Fidelity National Title Ins | |
| Naimi Ramin | $725,000 | -- |
Source: Public Records
Mortgage History
| Date | Status | Borrower | Loan Amount |
|---|---|---|---|
| Open | Hutchins Darren | $930,000 | |
| Previous Owner | Naimi Ramin | $580,000 |
Source: Public Records
Tax History Compared to Growth
Tax History
| Year | Tax Paid | Tax Assessment Tax Assessment Total Assessment is a certain percentage of the fair market value that is determined by local assessors to be the total taxable value of land and additions on the property. | Land | Improvement |
|---|---|---|---|---|
| 2025 | $21,624 | $1,706,028 | $838,851 | $867,177 |
| 2024 | $21,624 | $1,672,577 | $822,403 | $850,174 |
| 2023 | $21,254 | $1,639,782 | $806,278 | $833,504 |
| 2022 | $20,780 | $1,607,630 | $790,469 | $817,161 |
| 2021 | $20,438 | $1,576,109 | $774,970 | $801,139 |
| 2020 | $20,133 | $1,559,949 | $767,024 | $792,925 |
| 2019 | $19,746 | $1,529,363 | $751,985 | $777,378 |
| 2018 | $19,338 | $1,499,377 | $737,241 | $762,136 |
| 2017 | $19,047 | $1,469,979 | $722,786 | $747,193 |
| 2016 | $18,087 | $1,441,157 | $708,614 | $732,543 |
| 2015 | $17,755 | $1,419,510 | $697,970 | $721,540 |
| 2014 | $17,343 | $1,391,705 | $684,298 | $707,407 |
Source: Public Records
Map
Nearby Homes
- 14510 Blossom Hill Rd
- 5545 Laura Dr
- 102 Belvale Dr
- 118 Belridge Dr
- 103 Belridge Dr
- 5485 Sharon Ln
- 5743 Begonia Dr
- 1796 Chevalier Dr
- 1705 Blossom Hill Rd
- 1683 Zinnia Ln
- 5633 Drysdale Dr
- 206 Thomas Dr
- 0000 Harwood Rd
- 0 Greenridge Terrace Unit ML82009665
- 102 Hildebrand Dr
- 5220 Union Ave
- 2029 Los Gatos Almaden Rd
- 5222 Adalina Ct
- 15315 Santella Ct
- 14721 Shannon Rd