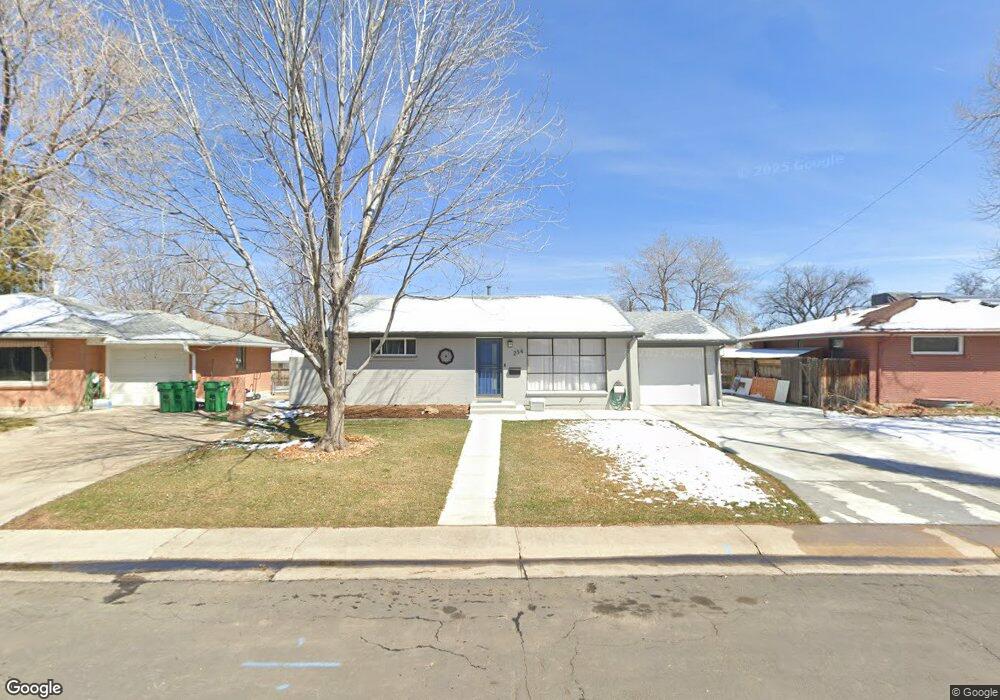
254 Beryl Way Broomfield, CO 80020
Broomfield Heights NeighborhoodEstimated Value: $483,472 - $528,000
3
Beds
2
Baths
1,120
Sq Ft
$453/Sq Ft
Est. Value
About This Home
This home is located at 254 Beryl Way, Broomfield, CO 80020 and is currently estimated at $506,824, approximately $452 per square foot. 254 Beryl Way is a home located in Broomfield County with nearby schools including Broomfield Heights Middle School, Broomfield High School, and Jefferson Academy Secondary School.
Ownership History
Date
Name
Owned For
Owner Type
Purchase Details
Closed on
Apr 14, 2021
Sold by
Lis Jill N
Bought by
Lis Jill N and Lis Tim Joseph
Current Estimated Value
Home Financials for this Owner
Home Financials are based on the most recent Mortgage that was taken out on this home.
Original Mortgage
$277,000
Outstanding Balance
$229,248
Interest Rate
3%
Mortgage Type
New Conventional
Estimated Equity
$277,576
Purchase Details
Closed on
Jan 20, 2021
Sold by
Lis Timothy J
Bought by
Lis Jil N
Purchase Details
Closed on
Oct 5, 2020
Sold by
Lis Timothy J and Estate Of Suzanne A Lis
Bought by
Lis Timothy J
Purchase Details
Closed on
Jul 7, 2020
Sold by
Lis Timothy J and Estate Of Suzanne A Lis
Bought by
Lis Timothy J
Purchase Details
Closed on
Sep 7, 2000
Create a Home Valuation Report for This Property
The Home Valuation Report is an in-depth analysis detailing your home's value as well as a comparison with similar homes in the area
Home Values in the Area
Average Home Value in this Area
Purchase History
| Date | Buyer | Sale Price | Title Company |
|---|---|---|---|
| Lis Jill N | -- | None Available | |
| Lis Jil N | -- | None Available | |
| Lis Timothy J | -- | None Available | |
| Lis Timothy J | -- | None Available | |
| -- | $85,800 | -- |
Source: Public Records
Mortgage History
| Date | Status | Borrower | Loan Amount |
|---|---|---|---|
| Open | Lis Jill N | $277,000 |
Source: Public Records
Tax History Compared to Growth
Tax History
| Year | Tax Paid | Tax Assessment Tax Assessment Total Assessment is a certain percentage of the fair market value that is determined by local assessors to be the total taxable value of land and additions on the property. | Land | Improvement |
|---|---|---|---|---|
| 2025 | $2,733 | $30,540 | $9,050 | $21,490 |
| 2024 | $2,733 | $29,170 | $8,030 | $21,140 |
| 2023 | $2,728 | $34,080 | $9,380 | $24,700 |
| 2022 | $2,346 | $24,270 | $6,600 | $17,670 |
| 2021 | $2,335 | $24,970 | $6,790 | $18,180 |
| 2020 | $2,181 | $23,180 | $6,080 | $17,100 |
| 2019 | $2,177 | $23,340 | $6,120 | $17,220 |
| 2018 | $1,800 | $19,070 | $4,570 | $14,500 |
| 2017 | $1,773 | $21,080 | $5,050 | $16,030 |
| 2016 | $1,567 | $16,620 | $5,050 | $11,570 |
| 2015 | $1,513 | $13,740 | $5,050 | $8,690 |
| 2014 | $1,279 | $13,740 | $5,050 | $8,690 |
Source: Public Records
Map
Nearby Homes
- 255 Beryl Way
- 290 Daphne Way
- 126 Beryl Way
- 400 W Midway Blvd
- 375 Hemlock St
- 216 Hemlock St
- 123 Emerald St
- 240 W 6th Ave
- 135 Garnet St
- 55 Emerald St
- 690 W 1st Ave
- 820 W 7th Avenue Dr
- 920 W 1st Ave
- 640 Kalmia Way
- 680 Kalmia Way
- 125 Laurel St
- 6801 W 118th Ave
- 1 Evergreen St
- 8005 Emerald Ln
- 1035 Iris St