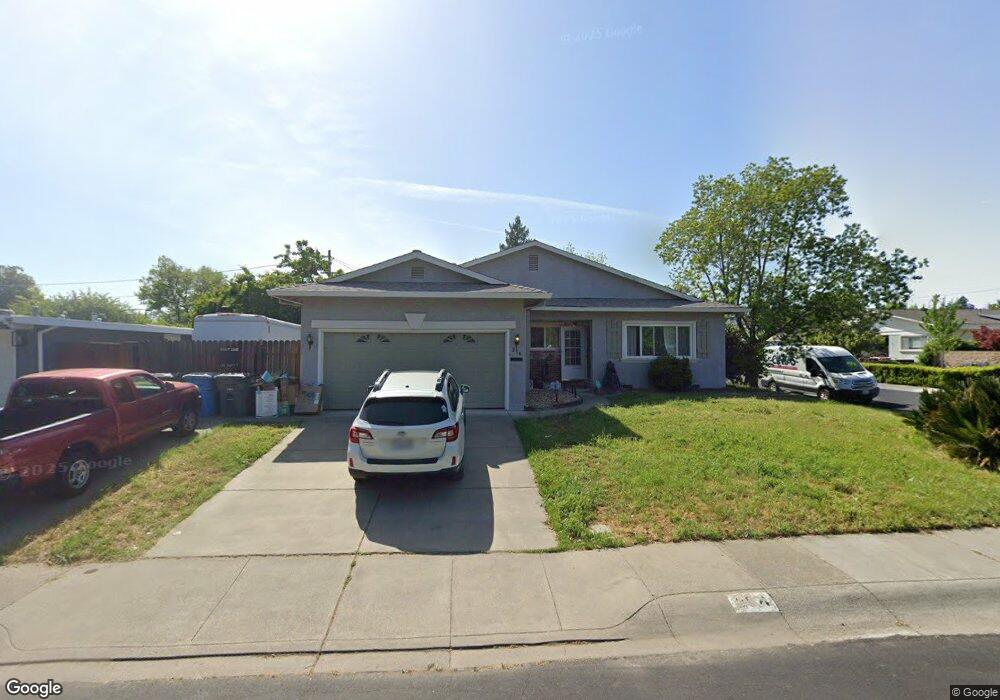
254 Cedar St Vacaville, CA 95688
Estimated Value: $499,000 - $539,000
3
Beds
2
Baths
1,294
Sq Ft
$398/Sq Ft
Est. Value
About This Home
This home is located at 254 Cedar St, Vacaville, CA 95688 and is currently estimated at $515,367, approximately $398 per square foot. 254 Cedar St is a home located in Solano County with nearby schools including Hemlock Elementary School, Orchard Elementary School, and Willis Jepson Middle School.
Ownership History
Date
Name
Owned For
Owner Type
Purchase Details
Closed on
Dec 17, 2025
Sold by
Rushing Zachary A
Bought by
Conde Rushing Family Trust and Rushing
Current Estimated Value
Purchase Details
Closed on
Jun 17, 2019
Sold by
Quillin Gaylord W and Quillin Elaine M
Bought by
Rushing Zachary A
Home Financials for this Owner
Home Financials are based on the most recent Mortgage that was taken out on this home.
Original Mortgage
$292,500
Interest Rate
4%
Mortgage Type
New Conventional
Purchase Details
Closed on
Dec 14, 2015
Sold by
Smead Dixie L
Bought by
Rushing Zachary A and Quillin Gaylor W
Home Financials for this Owner
Home Financials are based on the most recent Mortgage that was taken out on this home.
Original Mortgage
$309,294
Interest Rate
3.75%
Mortgage Type
FHA
Purchase Details
Closed on
Apr 4, 1994
Sold by
Smead Jack L and Smead Dixie L
Bought by
Smead Jack L and Smead Dixie L
Create a Home Valuation Report for This Property
The Home Valuation Report is an in-depth analysis detailing your home's value as well as a comparison with similar homes in the area
Purchase History
| Date | Buyer | Sale Price | Title Company |
|---|---|---|---|
| Conde Rushing Family Trust | -- | None Listed On Document | |
| Rushing Zachary A | $266,500 | Fidelity Title Co Syn | |
| Rushing Zachary A | $315,000 | Placer Title Company | |
| Smead Jack L | -- | -- |
Source: Public Records
Mortgage History
| Date | Status | Borrower | Loan Amount |
|---|---|---|---|
| Previous Owner | Rushing Zachary A | $292,500 | |
| Previous Owner | Rushing Zachary A | $309,294 |
Source: Public Records
Tax History
| Year | Tax Paid | Tax Assessment Tax Assessment Total Assessment is a certain percentage of the fair market value that is determined by local assessors to be the total taxable value of land and additions on the property. | Land | Improvement |
|---|---|---|---|---|
| 2025 | $4,209 | $372,886 | $82,861 | $290,025 |
| 2024 | $4,209 | $365,576 | $81,237 | $284,339 |
| 2023 | $4,108 | $358,409 | $79,645 | $278,764 |
| 2022 | $4,000 | $351,383 | $78,084 | $273,299 |
| 2021 | $4,006 | $344,494 | $76,553 | $267,941 |
| 2020 | $3,952 | $340,963 | $75,769 | $265,194 |
| 2019 | $3,964 | $334,279 | $74,284 | $259,995 |
| 2018 | $3,921 | $327,726 | $72,828 | $254,898 |
| 2017 | $3,791 | $321,300 | $71,400 | $249,900 |
| 2016 | $3,771 | $315,000 | $70,000 | $245,000 |
| 2015 | $502 | $48,876 | $10,179 | $38,697 |
| 2014 | $469 | $47,919 | $9,980 | $37,939 |
Source: Public Records
Map
Nearby Homes
- 239 Deodara St
- 317 Grape St
- 761 Pintail Ct
- 308 Buckeye St
- 345 Eldridge Ave
- 530 Eldridge Ave
- 365 Acacia St
- 306 Buck Ave
- 125 Kendal St
- 3001 Chardonnay Ct
- 2036 Zinfandel Ct
- 3042 Vasquez Ct
- 0 Parker St Unit 324045416
- 324 Woodside Cir
- 149 Mason St
- 136 Marco Ln
- 449 Cordoba Ln
- 456 Lovers Ln
- 757 Wesley Ave
- 6526 Gibson Canyon Rd
Your Personal Tour Guide
Ask me questions while you tour the home.