254 NW Ferry St Poulsbo, WA 98370
Lofall NeighborhoodEstimated Value: $1,012,000 - $1,325,000
2
Beds
1
Bath
1,390
Sq Ft
$829/Sq Ft
Est. Value
About This Home
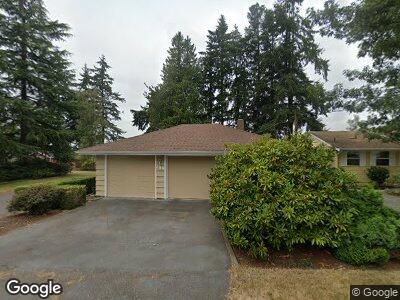
This home is located at 254 NW Ferry St, Poulsbo, WA 98370 and is currently estimated at $1,152,905, approximately $829 per square foot. 254 NW Ferry St is a home located in Kitsap County with nearby schools including Vinland Elementary School, Poulsbo Middle School, and North Kitsap High School.
Ownership History
Date
Name
Owned For
Owner Type
Purchase Details
Closed on
Apr 13, 2014
Sold by
Williams Brian J
Bought by
Williams Linda C
Current Estimated Value
Purchase Details
Closed on
Jan 3, 2013
Sold by
Skorheim Suzanne Claire
Bought by
Williams Brian James and Williams Linda C
Home Financials for this Owner
Home Financials are based on the most recent Mortgage that was taken out on this home.
Original Mortgage
$376,000
Interest Rate
3.54%
Mortgage Type
New Conventional
Purchase Details
Closed on
Oct 25, 2012
Sold by
Skorheim Suzanne Claire
Bought by
Skorheim Suzanne Claire
Purchase Details
Closed on
Feb 1, 2012
Sold by
Dion Romeo G
Bought by
Williams Brian J and Williams Linda C
Purchase Details
Closed on
Dec 21, 2011
Sold by
Dion Romeo G
Bought by
Dion Romeo G
Create a Home Valuation Report for This Property
The Home Valuation Report is an in-depth analysis detailing your home's value as well as a comparison with similar homes in the area
Home Values in the Area
Average Home Value in this Area
Purchase History
| Date | Buyer | Sale Price | Title Company |
|---|---|---|---|
| Williams Linda C | -- | None Available | |
| Williams Brian James | -- | Pacific Nw Title | |
| Skorheim Suzanne Claire | -- | None Available | |
| Williams Brian J | $469,000 | Land Title | |
| Dion Romeo G | -- | None Available |
Source: Public Records
Mortgage History
| Date | Status | Borrower | Loan Amount |
|---|---|---|---|
| Previous Owner | Williams Brian James | $376,000 | |
| Closed | Williams Brian J | $0 |
Source: Public Records
Tax History Compared to Growth
Tax History
| Year | Tax Paid | Tax Assessment Tax Assessment Total Assessment is a certain percentage of the fair market value that is determined by local assessors to be the total taxable value of land and additions on the property. | Land | Improvement |
|---|---|---|---|---|
| 2025 | $9,538 | $1,084,330 | $555,930 | $528,400 |
| 2024 | $7,759 | $908,840 | $480,600 | $428,240 |
| 2023 | $8,750 | $1,009,970 | $535,530 | $474,440 |
| 2022 | $7,254 | $793,660 | $446,270 | $347,390 |
| 2021 | $6,816 | $688,970 | $384,480 | $304,490 |
| 2020 | $6,915 | $688,970 | $384,480 | $304,490 |
| 2019 | $6,227 | $618,080 | $343,290 | $274,790 |
| 2018 | $6,036 | $496,630 | $284,520 | $212,110 |
| 2017 | $5,612 | $496,630 | $284,520 | $212,110 |
| 2016 | $5,502 | $447,930 | $258,650 | $189,280 |
| 2015 | $5,206 | $426,290 | $258,650 | $167,640 |
| 2014 | -- | $426,290 | $258,650 | $167,640 |
| 2013 | -- | $426,290 | $258,650 | $167,640 |
Source: Public Records
Map
Nearby Homes
- 287 NW Ferry St
- 690 NE Bluegill Way
- 28935 Beach Dr NE
- 26477 State Highway 3 NE
- 26495 NW Edgewater Blvd
- 26372 Edgewater Blvd NW
- 26217 Edgewater Place NW
- 2085 NW Swanlund St
- 25950 NW Circle Dr S
- 26182 NW Circle Dr
- 23490 Marinwood Cir NE Unit 1212
- 22 XX Scenic Dr NE
- 11 XX Scenic Dr NE
- 1134 NE Blue Ridge Dr
- 829 NW Pioneer Hill Rd
- 365 Seattle Dr
- 865 NW Pioneer Hill Rd
- 885 NW Pioneer Hill Rd
- 784 Thorndyke Rd
- 1750 NW Kekamek Dr