254 Rothell Rd Toccoa, GA 30577
Estimated Value: $198,000 - $208,688
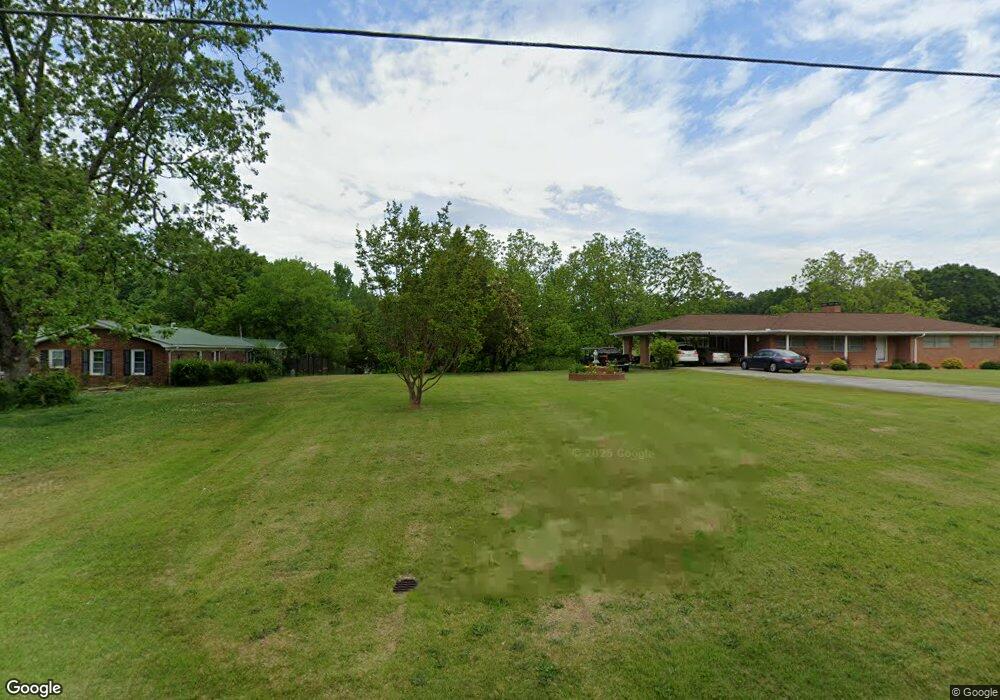
About This Home
This home is located at 254 Rothell Rd, Toccoa, GA 30577 and is currently estimated at $204,922, approximately $152 per square foot. 254 Rothell Rd is a home located in Stephens County with nearby schools including Stephens County High School.
Ownership History
We collect this data history from publicly available records. To have your information removed, we recommend requesting removal directly through your county’s website.
Purchase Details
Home Financials for this Owner
Home Financials are based on the most recent Mortgage that was taken out on this home.Purchase Details
Home Financials for this Owner
Home Financials are based on the most recent Mortgage that was taken out on this home.Purchase Details
Purchase Details
Purchase Details
Purchase History
We collect this data history from publicly available records. To have your information removed, we recommend requesting removal directly through your county’s website.
| Date | Buyer | Sale Price | Title Company |
|---|---|---|---|
| $165,000 | -- | ||
| $162,000 | -- | ||
| $125,000 | -- | ||
| $110,000 | -- | ||
| $2,500 | -- |
Mortgage History
We collect this data history from publicly available records. To have your information removed, we recommend requesting removal directly through your county’s website.
| Date | Status | Borrower | Loan Amount |
|---|---|---|---|
| Open | $162,010 | ||
| Previous Owner | $159,065 |
Tax History
We collect this data history from publicly available records. To have your information removed, we recommend requesting removal directly through your county’s website.
| Year | Tax Paid | Tax Assessment Tax Assessment Total Assessment is a certain percentage of the fair market value that is determined by local assessors to be the total taxable value of land and additions on the property. | Land | Improvement |
|---|---|---|---|---|
| 2025 | $2,441 | $69,961 | $2,304 | $67,657 |
| 2024 | $1,609 | $45,122 | $2,304 | $42,818 |
| 2023 | $1,414 | $41,672 | $2,304 | $39,368 |
| 2022 | $1,102 | $39,004 | $2,304 | $36,700 |
| 2021 | $814 | $21,852 | $660 | $21,192 |
| 2020 | $841 | $22,382 | $660 | $21,722 |
| 2019 | $844 | $22,382 | $660 | $21,722 |
| 2018 | $0 | $22,382 | $660 | $21,722 |
| 2017 | $0 | $22,382 | $660 | $21,722 |
| 2016 | $0 | $22,382 | $660 | $21,722 |
| 2015 | -- | $22,455 | $660 | $21,795 |
| 2014 | -- | $22,740 | $660 | $22,080 |
| 2013 | -- | $22,740 | $660 | $22,080 |
Map
- 258 Pebble Creek Dr
- 158 Pebble Creek Dr
- 1795 Skyline Dr
- 1226 Skyline Dr
- 31 Addington Ct
- 475 Hilltop Way
- 208 Cherry St
- 156 White Pine Rd
- 102 Cherry St
- 820 Collier Rd
- 683 Collier Rd
- 369 Skyline Dr
- 642 Skyline Dr
- 39 Meadowbrook Dr
- 0 Brookhaven Cir Unit 10616964
- 1288 Rose Ln
- 0 Stephen Dr Unit 10710969
- 0 Stephen Dr Unit 10710891
- 551 P S Rd
- 59 Lucille Ln
Ask me questions while you tour the home.