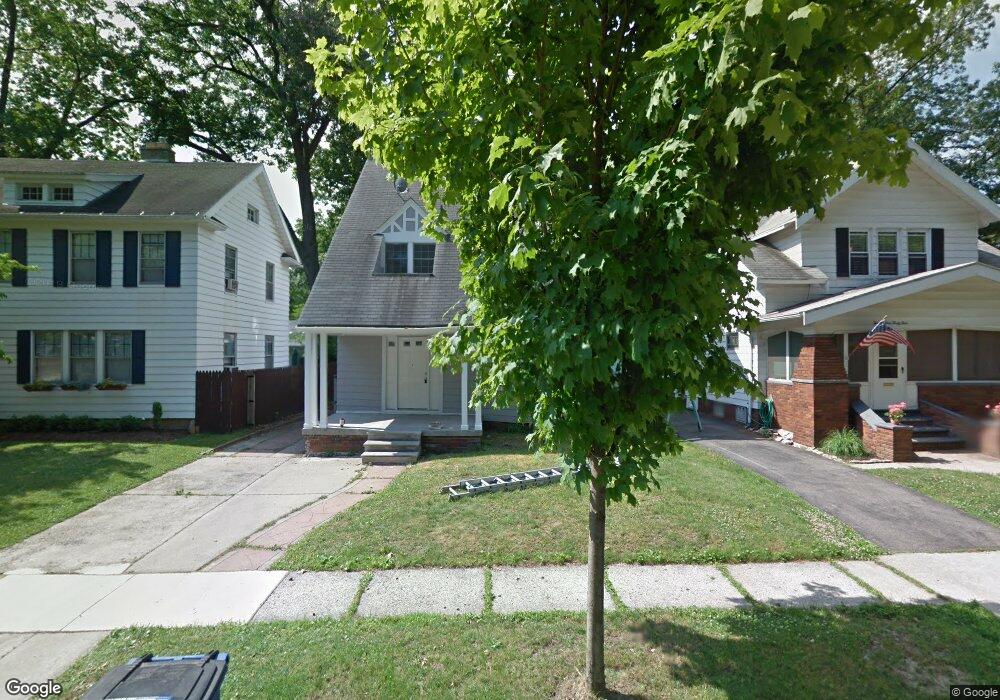
2541 Charlestown Ave Toledo, OH 43613
DeVeaux NeighborhoodEstimated Value: $143,240 - $163,000
3
Beds
2
Baths
1,522
Sq Ft
$99/Sq Ft
Est. Value
About This Home
This home is located at 2541 Charlestown Ave, Toledo, OH 43613 and is currently estimated at $151,060, approximately $99 per square foot. 2541 Charlestown Ave is a home located in Lucas County with nearby schools including DeVeaux Elementary School, Start High School, and Horizon Science Academy - Toledo High School.
Ownership History
Date
Name
Owned For
Owner Type
Purchase Details
Closed on
Oct 31, 2011
Sold by
Fielding Chad R and Fielding Jacqueline S
Bought by
Byrd Marcus M
Current Estimated Value
Home Financials for this Owner
Home Financials are based on the most recent Mortgage that was taken out on this home.
Original Mortgage
$52,826
Outstanding Balance
$35,760
Interest Rate
3.87%
Mortgage Type
FHA
Estimated Equity
$115,300
Purchase Details
Closed on
Jan 4, 2010
Sold by
Wells Fargo Financial Ohio 1 Inc
Bought by
Fielding Chad R and Fielding Jacqueline S
Home Financials for this Owner
Home Financials are based on the most recent Mortgage that was taken out on this home.
Original Mortgage
$28,800
Interest Rate
5.2%
Mortgage Type
New Conventional
Purchase Details
Closed on
Oct 28, 2009
Sold by
Powell Fred G
Bought by
Wells Fargo Financial Ohio 1 Inc
Purchase Details
Closed on
Mar 17, 1988
Sold by
Sakowski John J and Sakowski Ellen M
Create a Home Valuation Report for This Property
The Home Valuation Report is an in-depth analysis detailing your home's value as well as a comparison with similar homes in the area
Home Values in the Area
Average Home Value in this Area
Purchase History
| Date | Buyer | Sale Price | Title Company |
|---|---|---|---|
| Byrd Marcus M | $54,200 | Chicago Title | |
| Fielding Chad R | $36,000 | Attorney | |
| Wells Fargo Financial Ohio 1 Inc | $60,000 | None Available | |
| -- | $52,000 | -- |
Source: Public Records
Mortgage History
| Date | Status | Borrower | Loan Amount |
|---|---|---|---|
| Open | Byrd Marcus M | $52,826 | |
| Previous Owner | Fielding Chad R | $28,800 |
Source: Public Records
Tax History Compared to Growth
Tax History
| Year | Tax Paid | Tax Assessment Tax Assessment Total Assessment is a certain percentage of the fair market value that is determined by local assessors to be the total taxable value of land and additions on the property. | Land | Improvement |
|---|---|---|---|---|
| 2024 | $787 | $25,305 | $4,270 | $21,035 |
| 2023 | $1,183 | $17,815 | $7,385 | $10,430 |
| 2022 | $1,185 | $17,815 | $7,385 | $10,430 |
| 2021 | $1,209 | $17,815 | $7,385 | $10,430 |
| 2020 | $1,157 | $14,875 | $6,160 | $8,715 |
| 2019 | $1,122 | $14,875 | $6,160 | $8,715 |
| 2018 | $1,068 | $14,875 | $6,160 | $8,715 |
| 2017 | $1,015 | $12,600 | $5,215 | $7,385 |
| 2016 | $1,020 | $36,000 | $14,900 | $21,100 |
| 2015 | $1,011 | $36,000 | $14,900 | $21,100 |
| 2014 | $793 | $12,610 | $5,220 | $7,390 |
| 2013 | $793 | $12,610 | $5,220 | $7,390 |
Source: Public Records
Map
Nearby Homes
- 2560 Charlestown Ave
- 3905 Rushland Ave
- 2447 Portsmouth Ave
- 2433 Georgetown Ave
- 2426 Berdan Ave
- 4128 Douglas Rd
- 3823 Woodmont Rd
- 3714 Douglas Rd
- 3712 Douglas Rd
- 3723 Maxwell Rd
- 4015 Roanoke Rd
- 2255 Charlestown Ave
- 3840 Garrison Rd
- 4210 Bowen Rd
- 2645 Grantwood Dr
- 3805 Garrison Rd
- 3564 Rushland Ave
- 2624 Grantwood Dr
- 4315 Bales Rd
- 2277 Castlewood Dr
- 2537 Charlestown Ave
- 2545 Charlestown Ave
- 2549 Charlestown Ave
- 2529 Charlestown Ave
- 2553 Charlestown Ave
- 2540 Portsmouth Ave
- 2536 Portsmouth Ave
- 2544 Portsmouth Ave
- 2532 Portsmouth Ave
- 2548 Portsmouth Ave
- 2525 Charlestown Ave
- 2557 Charlestown Ave
- 2540 Charlestown Ave
- 2528 Portsmouth Ave
- 2552 Portsmouth Ave
- 2536 Charlestown Ave
- 2544 Charlestown Ave
- 2534 Charlestown Ave
- 2550 Charlestown Ave
- 2521 Charlestown Ave