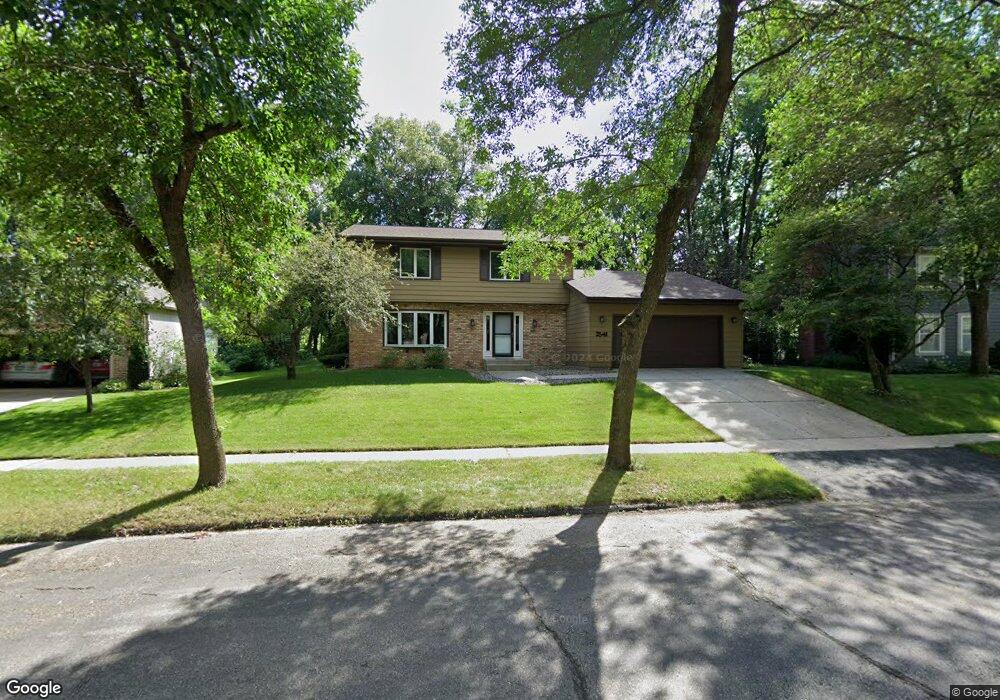
2541 Northridge Ln NE Rochester, MN 55906
Estimated Value: $379,458 - $451,000
4
Beds
3
Baths
2,504
Sq Ft
$163/Sq Ft
Est. Value
About This Home
This home is located at 2541 Northridge Ln NE, Rochester, MN 55906 and is currently estimated at $409,365, approximately $163 per square foot. 2541 Northridge Ln NE is a home located in Olmsted County with nearby schools including Churchill Elementary School, Hoover Elementary School, and Kellogg Middle School.
Ownership History
Date
Name
Owned For
Owner Type
Purchase Details
Closed on
Jul 9, 2021
Sold by
Agbamu Awesiri and Agbamu Allison
Bought by
Barnard Katie and Barnard William
Current Estimated Value
Home Financials for this Owner
Home Financials are based on the most recent Mortgage that was taken out on this home.
Original Mortgage
$346,114
Outstanding Balance
$314,045
Interest Rate
2.9%
Mortgage Type
FHA
Estimated Equity
$95,320
Purchase Details
Closed on
Jan 19, 2021
Sold by
Goracke Juan D and Goracke Don
Bought by
Agbamu Awesiri and Agbamu Allison
Home Financials for this Owner
Home Financials are based on the most recent Mortgage that was taken out on this home.
Original Mortgage
$324,900
Interest Rate
2.71%
Mortgage Type
New Conventional
Purchase Details
Closed on
Jul 25, 2016
Sold by
Dacy Matthew D and Dacy Lea C
Bought by
Goracke Juan D
Create a Home Valuation Report for This Property
The Home Valuation Report is an in-depth analysis detailing your home's value as well as a comparison with similar homes in the area
Home Values in the Area
Average Home Value in this Area
Purchase History
| Date | Buyer | Sale Price | Title Company |
|---|---|---|---|
| Barnard Katie | $352,500 | Attorneys Title Group Llc | |
| Agbamu Awesiri | $342,000 | Partners Title Llc | |
| Goracke Juan D | $175,000 | Burnet Title | |
| Agbamu Awesiri Awesiri | $342,000 | -- |
Source: Public Records
Mortgage History
| Date | Status | Borrower | Loan Amount |
|---|---|---|---|
| Open | Barnard Katie | $346,114 | |
| Previous Owner | Agbamu Awesiri | $324,900 | |
| Closed | Agbamu Awesiri Awesiri | $324,900 |
Source: Public Records
Tax History Compared to Growth
Tax History
| Year | Tax Paid | Tax Assessment Tax Assessment Total Assessment is a certain percentage of the fair market value that is determined by local assessors to be the total taxable value of land and additions on the property. | Land | Improvement |
|---|---|---|---|---|
| 2024 | $4,680 | $347,100 | $60,000 | $287,100 |
| 2023 | $4,106 | $326,000 | $60,000 | $266,000 |
| 2022 | $3,906 | $338,000 | $60,000 | $278,000 |
| 2021 | $3,414 | $293,200 | $60,000 | $233,200 |
| 2020 | $3,510 | $247,900 | $60,000 | $187,900 |
| 2019 | $3,342 | $244,400 | $38,900 | $205,500 |
| 2018 | $2,964 | $233,800 | $38,900 | $194,900 |
| 2017 | $2,772 | $211,800 | $38,900 | $172,900 |
| 2016 | $2,654 | $187,000 | $35,400 | $151,600 |
| 2015 | $2,512 | $175,000 | $35,000 | $140,000 |
| 2014 | $2,474 | $177,000 | $35,000 | $142,000 |
| 2012 | -- | $178,500 | $35,087 | $143,413 |
Source: Public Records
Map
Nearby Homes
- 703 Northern Hills Dr NE
- 2522 Northern Hills Ct NE
- 783 26th St NE
- 2708 Northern Valley Dr NE
- 722 Northern Heights Dr NE
- 2106 8th Ave NE
- 2809 Northern Valley Dr NE
- 559 21st St NE
- 827 Sierra Ln NE
- 2129 E Heights Ln NE
- 1723 Teton Ln NE
- 1513 Alexander Rd NE
- 2645 Riverside Ln NE
- 1620 Northern Valley Dr NE
- 4393 Cassidy Ridge Dr NE
- 1804 Northern Viola Ln NE
- 1561 11th Ave NE
- 1703 19th St NE
- 1872 Deerhaven Ln NE Unit 8
- 535 37th St NE
- 2535 Northridge Ln NE
- 2547 Northridge Ln NE
- 721 Northern Hills Dr NE
- 715 Northern Hills Dr NE
- 2529 Northridge Ln NE
- 2540 Northridge Ln NE
- 2553 Northridge Ln NE
- 2546 Northridge Ln NE
- 733 Northern Hills Dr NE
- 2532 Northridge Ln NE
- 2554 Northridge Ln NE
- 2523 Northridge Ln NE
- 720 Northern Hills Dr NE
- 2559 Northridge Ln NE
- 730 Northern Hills Dr NE
- 739 Northern Hills Dr NE
- 2528 Northridge Ln NE
- 714 Northern Hills Dr NE
- 2510 Northern Hills Ct NE
- 2560 Northridge Ln NE