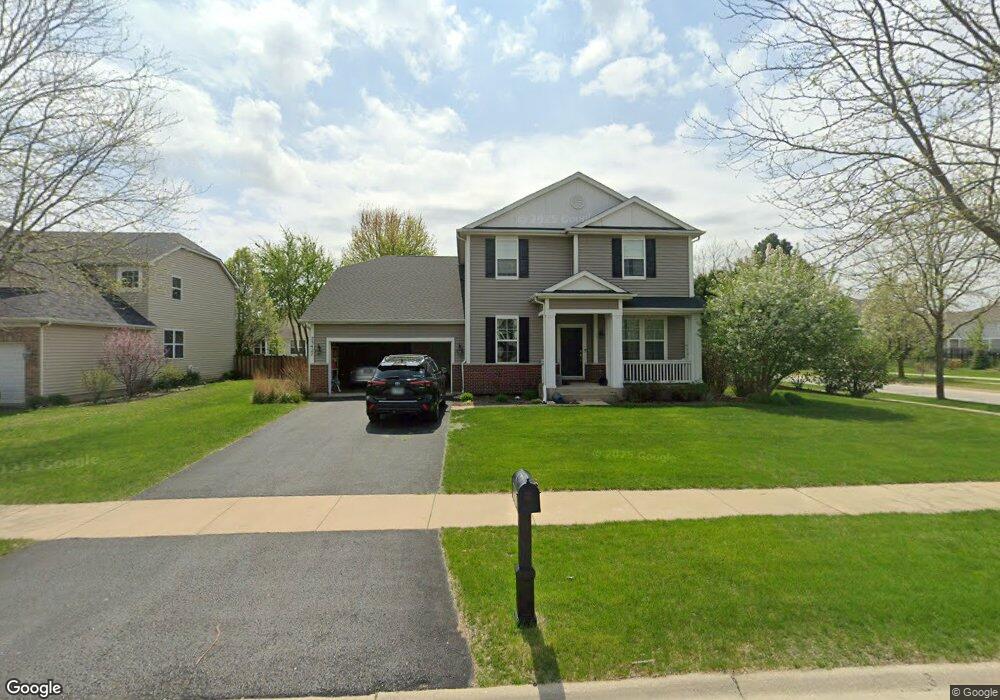
25427 Springview Ct Plainfield, IL 60586
West Plainfield NeighborhoodEstimated Value: $529,505 - $616,000
4
Beds
3
Baths
3,478
Sq Ft
$166/Sq Ft
Est. Value
About This Home
This home is located at 25427 Springview Ct, Plainfield, IL 60586 and is currently estimated at $576,876, approximately $165 per square foot. 25427 Springview Ct is a home located in Will County with nearby schools including Richard Ira Jones Middle School, Plainfield North High School, and St Mary Immaculate Parish School.
Ownership History
Date
Name
Owned For
Owner Type
Purchase Details
Closed on
May 27, 2010
Sold by
Jones Christopher A
Bought by
Shimer Wade and Mccarthy Jamie
Current Estimated Value
Home Financials for this Owner
Home Financials are based on the most recent Mortgage that was taken out on this home.
Original Mortgage
$264,931
Outstanding Balance
$179,979
Interest Rate
5.25%
Mortgage Type
FHA
Estimated Equity
$396,897
Purchase Details
Closed on
Nov 26, 2008
Sold by
Lennar Communities Of Chicago Llc
Bought by
Jones Christopher A
Home Financials for this Owner
Home Financials are based on the most recent Mortgage that was taken out on this home.
Original Mortgage
$241,808
Interest Rate
6.04%
Mortgage Type
FHA
Purchase Details
Closed on
Jul 2, 2007
Sold by
Creekside Crossing Llc
Bought by
Lennar Communities Of Chicago Llc
Create a Home Valuation Report for This Property
The Home Valuation Report is an in-depth analysis detailing your home's value as well as a comparison with similar homes in the area
Home Values in the Area
Average Home Value in this Area
Purchase History
| Date | Buyer | Sale Price | Title Company |
|---|---|---|---|
| Shimer Wade | $268,500 | Bt | |
| Jones Christopher A | $245,000 | North American Title Co | |
| Lennar Communities Of Chicago Llc | $417,500 | Chicago Title Insurance |
Source: Public Records
Mortgage History
| Date | Status | Borrower | Loan Amount |
|---|---|---|---|
| Open | Shimer Wade | $264,931 | |
| Previous Owner | Jones Christopher A | $241,808 |
Source: Public Records
Tax History
| Year | Tax Paid | Tax Assessment Tax Assessment Total Assessment is a certain percentage of the fair market value that is determined by local assessors to be the total taxable value of land and additions on the property. | Land | Improvement |
|---|---|---|---|---|
| 2024 | $11,378 | $162,341 | $25,907 | $136,434 |
| 2023 | $11,378 | $146,623 | $23,399 | $123,224 |
| 2022 | $10,899 | $139,042 | $17,303 | $121,739 |
| 2021 | $10,204 | $129,946 | $16,171 | $113,775 |
| 2020 | $10,061 | $126,259 | $15,712 | $110,547 |
| 2019 | $9,709 | $120,304 | $14,971 | $105,333 |
| 2018 | $8,721 | $106,602 | $14,066 | $92,536 |
| 2017 | $8,451 | $101,304 | $13,367 | $87,937 |
| 2016 | $7,317 | $86,437 | $12,749 | $73,688 |
| 2015 | $5,952 | $80,972 | $11,943 | $69,029 |
| 2014 | $5,952 | $68,113 | $11,521 | $56,592 |
| 2013 | $5,952 | $68,113 | $11,521 | $56,592 |
Source: Public Records
Map
Nearby Homes
- 25420 W Springview Dr
- 25504 W Rocky Creek Rd
- 25220 W Zoumar Dr
- 16151 S Lake View Rd
- 16143 S Lake View Rd
- 16155 S Lake View Rd
- 15738 Creekview Dr
- 25529 W Streamwood Ln
- 16332 S Forest Edge Dr
- 15339 S Sawgrass Cir
- 25732 W Wakefield Dr
- 25736 W Wakefield Dr
- 25716 W Wakefield Dr
- 25738 W Wakefield Dr
- 25716 W Yorkshire Dr
- 25746 W Yorkshire Dr
- 25728 W Yorkshire Dr
- 25722 W Yorkshire Dr
- 25748 W Yorkshire Dr
- 24817 Petit Ct
- 25423 Springview Ct
- 26651 Springview Dr
- 16005 Longcommon Ln
- 25419 Springview Ct
- 16001 Longcommon Ln
- 25551 W Springview Dr
- 25553 W Springview Dr
- 25428 Springview Ct
- 25424 Springview Ct
- 16009 S Longcommon Ln
- 25415 Springview Ct
- 25542 W Maurice Ln
- 25550 W Springview Dr
- 25420 Springview Ct
- 25552 W Springview Dr
- 25544 W Maurice Ln
- 25416 Springview Ct
- 25557 W Springview Dr
- 25555 W Springview Dr
- 16013 Longcommon Ln
Your Personal Tour Guide
Ask me questions while you tour the home.