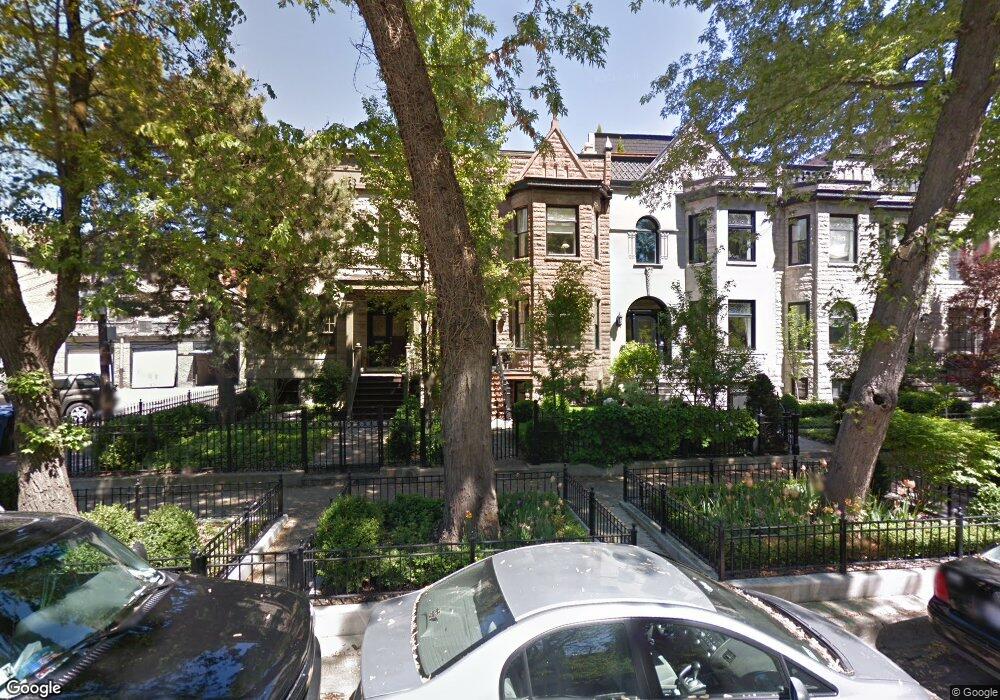
2543 N Burling St Chicago, IL 60614
Lincoln Park NeighborhoodEstimated Value: $2,471,738 - $2,557,000
5
Beds
10
Baths
3,120
Sq Ft
$806/Sq Ft
Est. Value
About This Home
This home is located at 2543 N Burling St, Chicago, IL 60614 and is currently estimated at $2,515,435, approximately $806 per square foot. 2543 N Burling St is a home located in Cook County with nearby schools including Alcott Elementary School, Lincoln Park High School, and Saint Clement School.
Ownership History
Date
Name
Owned For
Owner Type
Purchase Details
Closed on
Apr 29, 2003
Sold by
Hernandez Kalman Gregory R and Hernandez Kalman Marissa
Bought by
Shivers Vance Iii Leslie Byron and Shivers Vance Miller
Current Estimated Value
Home Financials for this Owner
Home Financials are based on the most recent Mortgage that was taken out on this home.
Original Mortgage
$990,500
Outstanding Balance
$405,646
Interest Rate
5%
Mortgage Type
Unknown
Estimated Equity
$2,109,789
Purchase Details
Closed on
Aug 9, 1999
Sold by
Kalman Gregg and Kalman Marissa H
Bought by
The Kalman Family Trust
Purchase Details
Closed on
Sep 3, 1998
Sold by
Gallo Christine
Bought by
Kalman Gregg and Kalman Marissa H
Home Financials for this Owner
Home Financials are based on the most recent Mortgage that was taken out on this home.
Original Mortgage
$480,000
Interest Rate
6.9%
Create a Home Valuation Report for This Property
The Home Valuation Report is an in-depth analysis detailing your home's value as well as a comparison with similar homes in the area
Home Values in the Area
Average Home Value in this Area
Purchase History
| Date | Buyer | Sale Price | Title Company |
|---|---|---|---|
| Shivers Vance Iii Leslie Byron | $1,415,000 | Multiple | |
| Shivers Vance Iii Leslie Byron | $1,415,000 | Multiple | |
| The Kalman Family Trust | -- | -- | |
| Kalman Gregg | $600,000 | Professional National Title |
Source: Public Records
Mortgage History
| Date | Status | Borrower | Loan Amount |
|---|---|---|---|
| Open | Shivers Vance Iii Leslie Byron | $990,500 | |
| Closed | Shivers Vance Iii Leslie Byron | $990,500 | |
| Previous Owner | Kalman Gregg | $480,000 | |
| Closed | Shivers Vance Iii Leslie Byron | $241,500 |
Source: Public Records
Tax History Compared to Growth
Tax History
| Year | Tax Paid | Tax Assessment Tax Assessment Total Assessment is a certain percentage of the fair market value that is determined by local assessors to be the total taxable value of land and additions on the property. | Land | Improvement |
|---|---|---|---|---|
| 2024 | $51,626 | $224,000 | $45,058 | $178,942 |
| 2023 | $50,306 | $248,000 | $36,288 | $211,712 |
| 2022 | $50,306 | $248,000 | $36,288 | $211,712 |
| 2021 | $49,201 | $248,000 | $36,288 | $211,712 |
| 2020 | $40,652 | $185,587 | $21,772 | $163,815 |
| 2019 | $39,404 | $199,556 | $21,772 | $177,784 |
| 2018 | $38,740 | $199,556 | $21,772 | $177,784 |
| 2017 | $29,889 | $142,221 | $19,353 | $122,868 |
| 2016 | $27,985 | $142,221 | $19,353 | $122,868 |
| 2015 | $25,581 | $142,221 | $19,353 | $122,868 |
| 2014 | $24,967 | $137,132 | $16,329 | $120,803 |
| 2013 | $24,463 | $137,132 | $16,329 | $120,803 |
Source: Public Records
Map
Nearby Homes
- 747 W Wrightwood Ave Unit C
- 2529 N Halsted St Unit P9
- 2468 N Orchard St
- 2678 N Orchard St
- 843 W Lill Ave Unit 2
- 637 W Wrightwood Ave Unit 4W
- 639 W Schubert Ave
- 2661 N Dayton St
- 2703 N Halsted St Unit 2
- 2717 N Dayton St
- 2719 N Dayton St
- 2422 N Orchard St
- 2711 N Mildred Ave Unit 3A
- 2610 N Mildred Ave Unit 201
- 845 W Altgeld St Unit 3A
- 2403 N Orchard St Unit G
- 914 W Wrightwood Ave Unit 1
- 2728 N Hampden Ct Unit 109
- 2728 N Hampden Ct Unit 605
- 886 W Lill Ave Unit 1
- 2541 N Burling St
- 2545 N Burling St
- 2545 N Burling St
- 2537 N Burling St
- 2537 N Burling St
- 2533 N Burling St Unit 3
- 2533 N Burling St Unit 1
- 2533 N Burling St Unit 2
- 715 W Wrightwood Ave
- 2531 N Burling St
- 2531 N Burling St Unit 1
- 2531 N Burling St Unit 2
- 2531 N Burling St Unit 3
- 719 W Wrightwood Ave
- 719 W Wrightwood Ave Unit 2
- 719 W Wrightwood Ave Unit 4
- 719 W Wrightwood Ave Unit 3
- 723 W Wrightwood Ave
- 723 W Wrightwood Ave Unit 3
- 723 W Wrightwood Ave Unit 2