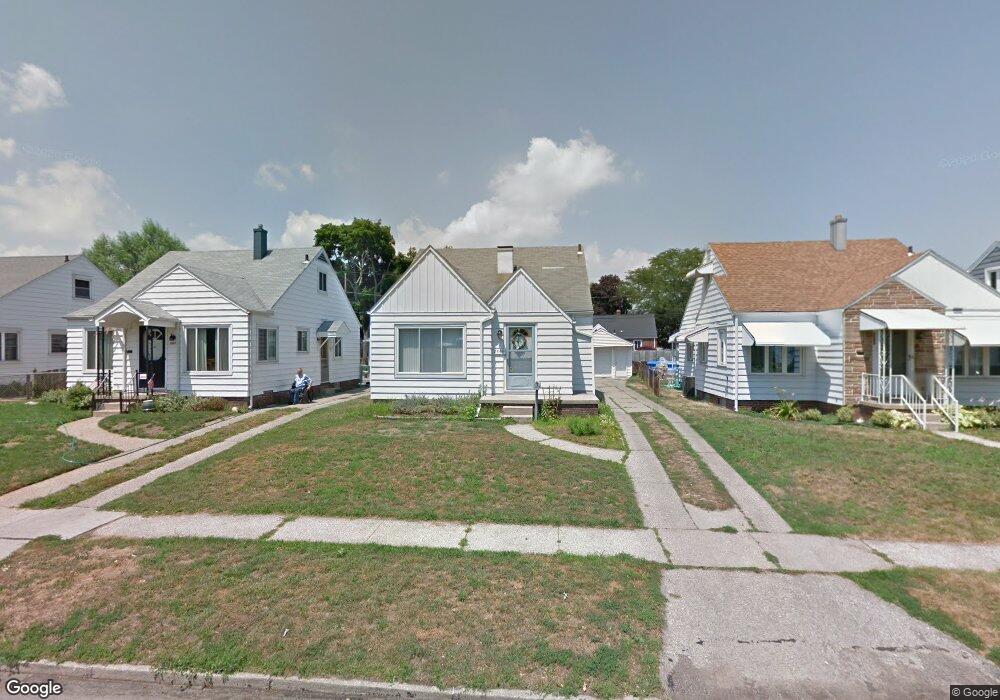
2544 Lambert Dr Toledo, OH 43613
DeVeaux NeighborhoodEstimated Value: $157,000 - $184,000
3
Beds
1
Bath
1,185
Sq Ft
$140/Sq Ft
Est. Value
About This Home
This home is located at 2544 Lambert Dr, Toledo, OH 43613 and is currently estimated at $166,424, approximately $140 per square foot. 2544 Lambert Dr is a home located in Lucas County with nearby schools including Elmhurst Elementary School, Start High School, and Horizon Science Academy - Toledo High School.
Ownership History
Date
Name
Owned For
Owner Type
Purchase Details
Closed on
Dec 13, 2011
Sold by
Shock Rod E and Shock Chantell M
Bought by
Shock Rod E and Shock Chantell M
Current Estimated Value
Purchase Details
Closed on
Oct 23, 2007
Sold by
Brass Mark A
Bought by
Shock Rod E and Stambaugh Chantell M
Home Financials for this Owner
Home Financials are based on the most recent Mortgage that was taken out on this home.
Original Mortgage
$107,650
Outstanding Balance
$66,685
Interest Rate
6.33%
Mortgage Type
Purchase Money Mortgage
Estimated Equity
$99,739
Purchase Details
Closed on
Jun 28, 2002
Sold by
Hale Chad B and Hale Amy J
Bought by
Brass Mark A
Purchase Details
Closed on
Apr 9, 1996
Sold by
Charles R Testa Exec
Bought by
Hale Chad B and Stamper Amy J
Home Financials for this Owner
Home Financials are based on the most recent Mortgage that was taken out on this home.
Original Mortgage
$57,950
Interest Rate
7.36%
Mortgage Type
New Conventional
Create a Home Valuation Report for This Property
The Home Valuation Report is an in-depth analysis detailing your home's value as well as a comparison with similar homes in the area
Home Values in the Area
Average Home Value in this Area
Purchase History
| Date | Buyer | Sale Price | Title Company |
|---|---|---|---|
| Shock Rod E | -- | Attorney | |
| Shock Rod E | $108,000 | Attorney | |
| Brass Mark A | $103,000 | Northwest Title Agency Of Oh | |
| Hale Chad B | $61,000 | -- |
Source: Public Records
Mortgage History
| Date | Status | Borrower | Loan Amount |
|---|---|---|---|
| Open | Shock Rod E | $107,650 | |
| Previous Owner | Hale Chad B | $57,950 |
Source: Public Records
Tax History
| Year | Tax Paid | Tax Assessment Tax Assessment Total Assessment is a certain percentage of the fair market value that is determined by local assessors to be the total taxable value of land and additions on the property. | Land | Improvement |
|---|---|---|---|---|
| 2025 | -- | $40,635 | $6,405 | $34,230 |
| 2024 | $1,225 | $40,635 | $6,405 | $34,230 |
| 2023 | $1,978 | $31,185 | $5,740 | $25,445 |
| 2022 | $1,981 | $31,185 | $5,740 | $25,445 |
| 2021 | $2,030 | $31,185 | $5,740 | $25,445 |
| 2020 | $1,943 | $26,355 | $4,760 | $21,595 |
| 2019 | $1,892 | $26,355 | $4,760 | $21,595 |
| 2018 | $1,878 | $26,355 | $4,760 | $21,595 |
| 2017 | $1,888 | $24,920 | $4,585 | $20,335 |
| 2016 | $1,881 | $71,200 | $13,100 | $58,100 |
| 2015 | $1,862 | $71,200 | $13,100 | $58,100 |
| 2014 | $1,568 | $24,930 | $4,590 | $20,340 |
| 2013 | $1,568 | $24,930 | $4,590 | $20,340 |
Source: Public Records
Map
Nearby Homes
- 2544 Oak Grove Place
- 2659 Oak Grove Place
- 2313 Oak Grove Place
- 4220 Douglas Rd
- 2316 Westbrook Dr
- 4726 Bowen Rd
- 2842 Oak Grove Place
- 2846 Elsie Ave
- 4214 Grantley Rd
- 2645 Boxwood Rd
- 4914 Bales Rd
- 2834 Wyndale Rd
- 4924 Roywood Rd
- 4233 Garrison Rd
- 4932 Bales Rd
- 2285 Castlewood Dr
- 4402 Drummond Rd
- 2544 Charlestown Ave
- 4722 Bowser Dr
- 4807 Brott Rd
- 2550 Lambert Dr
- 2540 Lambert Dr
- 2554 Lambert Dr
- 2536 Lambert Dr
- 2558 Lambert Dr
- 2532 Lambert Dr
- 2543 Castleton Ave
- 2547 Castleton Ave
- 2539 Castleton Ave
- 2551 Castleton Ave
- 2528 Lambert Dr
- 2531 Castleton Ave
- 2560 Lambert Dr
- 2539 Lambert Dr
- 2543 Lambert Dr
- 2537 Lambert Dr
- 2549 Lambert Dr
- 2533 Lambert Dr
- 2527 Castleton Ave
- 2553 Lambert Dr
Your Personal Tour Guide
Ask me questions while you tour the home.