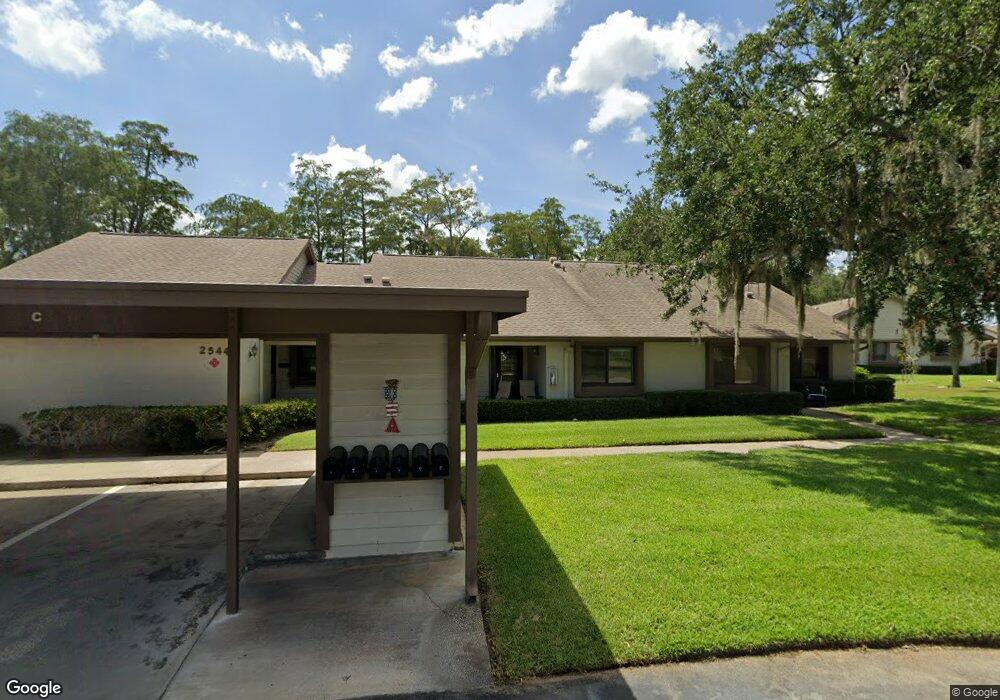
2544 Laurelwood Dr Unit 10A Clearwater, FL 33763
Woodgate NeighborhoodEstimated Value: $198,566 - $234,000
--
Bed
--
Bath
935
Sq Ft
$228/Sq Ft
Est. Value
About This Home
This home is located at 2544 Laurelwood Dr Unit 10A, Clearwater, FL 33763 and is currently estimated at $213,142, approximately $227 per square foot. 2544 Laurelwood Dr Unit 10A is a home located in Pinellas County with nearby schools including Leila Davis Elementary School, Countryside High School, and Safety Harbor Middle School.
Ownership History
Date
Name
Owned For
Owner Type
Purchase Details
Closed on
Nov 24, 2020
Sold by
Clarridge Judith K
Bought by
Clarridge Sally and Clarridge John
Current Estimated Value
Purchase Details
Closed on
Jul 3, 2002
Sold by
Michie James and Michie Eleanor
Bought by
Clarridge Judith K
Home Financials for this Owner
Home Financials are based on the most recent Mortgage that was taken out on this home.
Original Mortgage
$52,000
Outstanding Balance
$22,169
Interest Rate
6.79%
Mortgage Type
New Conventional
Estimated Equity
$190,973
Purchase Details
Closed on
Sep 29, 2000
Sold by
Robinson Mary A
Bought by
Michie James and Michie Eleanor
Purchase Details
Closed on
Dec 6, 1995
Sold by
Degner Lutz
Bought by
Robinson Mary A
Home Financials for this Owner
Home Financials are based on the most recent Mortgage that was taken out on this home.
Original Mortgage
$55,000
Interest Rate
7.4%
Mortgage Type
VA
Create a Home Valuation Report for This Property
The Home Valuation Report is an in-depth analysis detailing your home's value as well as a comparison with similar homes in the area
Home Values in the Area
Average Home Value in this Area
Purchase History
| Date | Buyer | Sale Price | Title Company |
|---|---|---|---|
| Clarridge Sally | -- | Accommodation | |
| Clarridge Judith K | $87,000 | -- | |
| Michie James | $68,000 | -- | |
| Robinson Mary A | $59,000 | -- |
Source: Public Records
Mortgage History
| Date | Status | Borrower | Loan Amount |
|---|---|---|---|
| Open | Robinson Mary A | $52,000 | |
| Previous Owner | Robinson Mary A | $55,000 |
Source: Public Records
Tax History Compared to Growth
Tax History
| Year | Tax Paid | Tax Assessment Tax Assessment Total Assessment is a certain percentage of the fair market value that is determined by local assessors to be the total taxable value of land and additions on the property. | Land | Improvement |
|---|---|---|---|---|
| 2024 | $558 | $64,668 | -- | -- |
| 2023 | $558 | $62,784 | $0 | $0 |
| 2022 | $550 | $60,955 | $0 | $0 |
| 2021 | $566 | $59,180 | $0 | $0 |
| 2020 | $568 | $58,363 | $0 | $0 |
| 2019 | $565 | $57,051 | $0 | $0 |
| 2018 | $563 | $55,987 | $0 | $0 |
| 2017 | $544 | $54,835 | $0 | $0 |
| 2016 | $545 | $53,707 | $0 | $0 |
| 2015 | $555 | $53,334 | $0 | $0 |
| 2014 | $554 | $52,911 | $0 | $0 |
Source: Public Records
Map
Nearby Homes
- 2588 Laurelwood Dr Unit 16A
- 2510 Laurelwood Dr Unit 5-B
- 2541 Laurelwood Dr Unit 8C
- 2550 Royal Pines Cir Unit 12C
- 2549 Royal Pines Cir Unit 16H
- 2549 Royal Pines Cir Unit 16-G
- 2549 Oakleaf Ln Unit 36C
- 2567 Oakleaf Ln Unit 41
- 2521 Oakleaf Ln Unit 28C
- 2546 Oakleaf Ln Unit 35D
- 2537 Royal Pines Cir Unit 19D
- 2566 Bay Berry Dr
- 2484 Laurelwood Dr Unit C
- 2211 Bay Berry Ln
- 2218 Bay Berry Ln
- 2190 Bramblewood Dr N
- 2456 Bay Berry Ct
- 2186 Greenbriar Blvd
- 2284 Oak Neck Rd Unit E
- 2589 Redwood Cir
- 2576 Laurelwood Dr Unit 13-A
- 2596 Laurelwood Dr Unit 18C
- 2596 Laurelwood Dr Unit 18B
- 2596 Laurelwood Dr Unit 18A
- 2592 Laurelwood Dr Unit B
- 2592 Laurelwood Dr Unit 17A
- 2588 Laurelwood Dr Unit 16B
- 2584 Laurelwood Dr Unit 15B
- 2584 Laurelwood Dr Unit 15A
- 2580 Laurelwood Dr Unit 14B
- 2580 Laurelwood Dr Unit 14A
- 2576 Laurelwood Dr Unit 13B
- 2576 Laurelwood Dr Unit A
- 2568 Laurelwood Dr Unit 11B
- 2568 Laurelwood Dr
- 2544 Laurelwood Dr Unit 10B
- 2540 Laurelwood Dr
- 2540 Laurelwood Dr Unit 9A
- 2530 Laurelwood Dr Unit 8B
- 2530 Laurelwood Dr Unit 8A