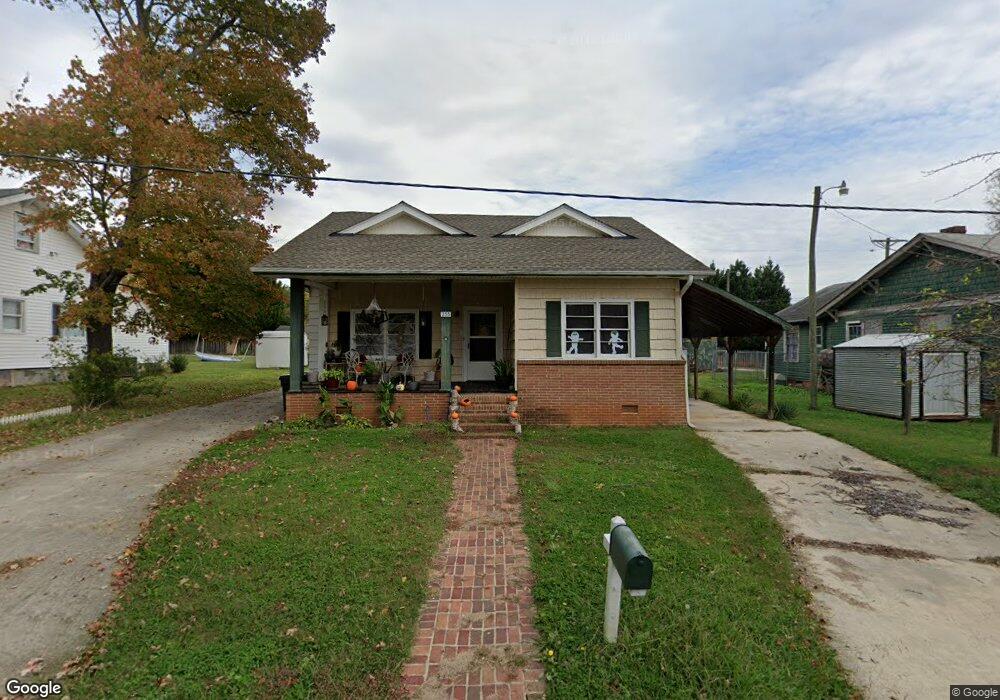
255 Broad St Lexington, NC 27295
Estimated Value: $97,000 - $158,000
2
Beds
1
Bath
1,931
Sq Ft
$64/Sq Ft
Est. Value
About This Home
This home is located at 255 Broad St, Lexington, NC 27295 and is currently estimated at $122,673, approximately $63 per square foot. 255 Broad St is a home located in Davidson County with nearby schools including South Lexington School, Lexington Middle School, and Lexington Senior High School.
Ownership History
Date
Name
Owned For
Owner Type
Purchase Details
Closed on
Apr 2, 2009
Sold by
The Bank Of New York Mellon
Bought by
Kom Bunsong and Kom Davy
Current Estimated Value
Purchase Details
Closed on
Mar 30, 2009
Sold by
Soriano Rolando
Bought by
Suntrust Mortgage Inc
Purchase Details
Closed on
Mar 31, 2005
Sold by
Hampton David Samuel
Bought by
Soriano Rolando
Home Financials for this Owner
Home Financials are based on the most recent Mortgage that was taken out on this home.
Original Mortgage
$41,400
Interest Rate
6.12%
Mortgage Type
Purchase Money Mortgage
Purchase Details
Closed on
Aug 1, 1998
Create a Home Valuation Report for This Property
The Home Valuation Report is an in-depth analysis detailing your home's value as well as a comparison with similar homes in the area
Home Values in the Area
Average Home Value in this Area
Purchase History
| Date | Buyer | Sale Price | Title Company |
|---|---|---|---|
| Kom Bunsong | $27,000 | None Available | |
| The Bank Of New York Mellon | -- | None Available | |
| Suntrust Mortgage Inc | $46,607 | None Available | |
| Soriano Rolando | $46,000 | None Available | |
| -- | -- | -- |
Source: Public Records
Mortgage History
| Date | Status | Borrower | Loan Amount |
|---|---|---|---|
| Previous Owner | Soriano Rolando | $41,400 |
Source: Public Records
Tax History
| Year | Tax Paid | Tax Assessment Tax Assessment Total Assessment is a certain percentage of the fair market value that is determined by local assessors to be the total taxable value of land and additions on the property. | Land | Improvement |
|---|---|---|---|---|
| 2025 | $705 | $54,220 | $0 | $0 |
| 2024 | $705 | $54,220 | $0 | $0 |
| 2023 | $705 | $54,220 | $0 | $0 |
| 2022 | $705 | $54,220 | $0 | $0 |
| 2021 | $705 | $54,220 | $0 | $0 |
| 2020 | $546 | $42,340 | $0 | $0 |
| 2019 | $555 | $42,340 | $0 | $0 |
| 2018 | $555 | $42,340 | $0 | $0 |
| 2017 | $555 | $42,340 | $0 | $0 |
| 2016 | $555 | $42,340 | $0 | $0 |
| 2015 | $533 | $42,340 | $0 | $0 |
| 2014 | $642 | $50,970 | $0 | $0 |
Source: Public Records
Map
Nearby Homes
- 708 1st Rainbow St
- 33 Mill St
- 37 Mill St
- 1409 Winston Rd
- 1016 Harb Dr
- 1017 Harb Dr
- 1026 Harb Dr
- 1 Harb Dr
- 816 Olympia St Unit 292
- 816 Olympia St
- 106 Emlee St
- 206 Choyce St
- 138 Elizabeth St
- 12 Hawthorne Ln
- 00 E 9th St
- 22 Covey Ct
- 385 Harper Mill Cir
- 381 Harper Mill Cir
- 367 Harper Mill Cir
- 361 Harper Mill Cir
Your Personal Tour Guide
Ask me questions while you tour the home.