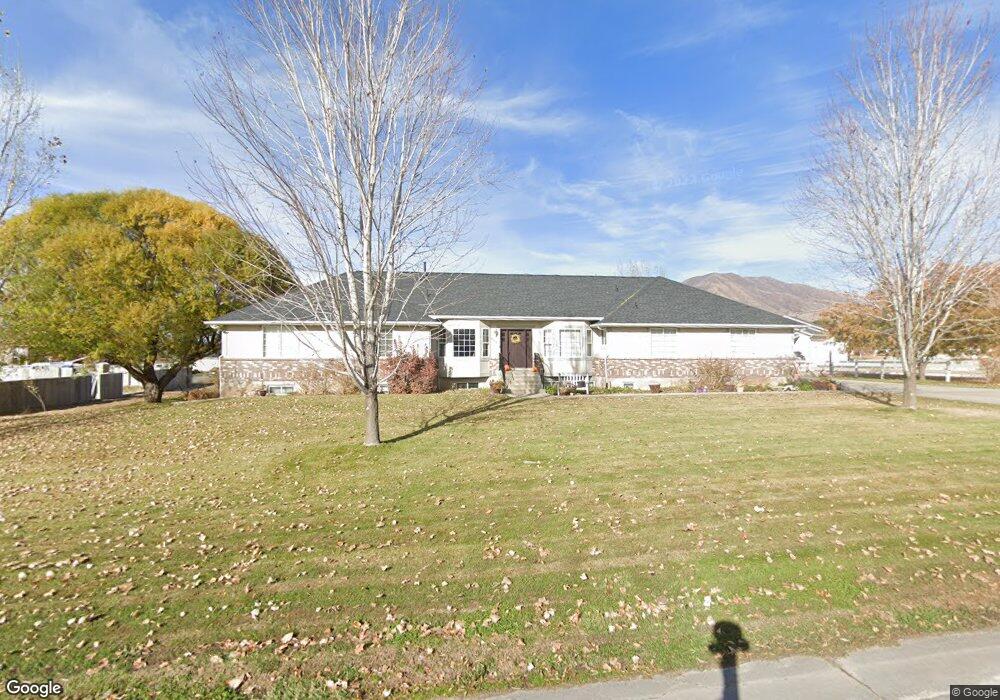
255 E 1100 S Mapleton, UT 84664
Estimated Value: $1,357,000 - $1,571,878
6
Beds
5
Baths
4,104
Sq Ft
$357/Sq Ft
Est. Value
About This Home
This home is located at 255 E 1100 S, Mapleton, UT 84664 and is currently estimated at $1,464,439, approximately $356 per square foot. 255 E 1100 S is a home located in Utah County with nearby schools including Mapleton School, Mapleton Junior High School, and Maple Mountain High School.
Ownership History
Date
Name
Owned For
Owner Type
Purchase Details
Closed on
Mar 26, 2021
Sold by
Simpson Craig and Simpson Shelly C
Bought by
Simpson Family Trust and Simpson
Current Estimated Value
Home Financials for this Owner
Home Financials are based on the most recent Mortgage that was taken out on this home.
Original Mortgage
$548,250
Interest Rate
2.7%
Mortgage Type
New Conventional
Purchase Details
Closed on
Feb 22, 2021
Sold by
Simpson Craig
Bought by
Simpson Craig and Simpson Shelly C
Home Financials for this Owner
Home Financials are based on the most recent Mortgage that was taken out on this home.
Original Mortgage
$548,250
Interest Rate
2.7%
Mortgage Type
New Conventional
Purchase Details
Closed on
Mar 2, 2016
Sold by
Simpson Crig and Simpson Shelly
Bought by
Simpson Craig and Simpson Shelly C
Home Financials for this Owner
Home Financials are based on the most recent Mortgage that was taken out on this home.
Original Mortgage
$391,000
Interest Rate
3.81%
Mortgage Type
New Conventional
Purchase Details
Closed on
Aug 22, 2006
Sold by
Bastian Sid P and Bastian Leslie T
Bought by
Bastian Sid P and Bastian Leslie T
Purchase Details
Closed on
Aug 5, 2005
Sold by
Ballard Jay A and Layne Ballard D
Bought by
Simpson Craig and Simpson Shelly
Purchase Details
Closed on
Aug 28, 2001
Sold by
Bankers Trust Company Of California Na
Bought by
Ballard Jay A and Layne Ballard D
Home Financials for this Owner
Home Financials are based on the most recent Mortgage that was taken out on this home.
Original Mortgage
$275,000
Interest Rate
7.05%
Purchase Details
Closed on
Oct 28, 1998
Sold by
Helland Frank
Bought by
Helland Frank and Helland Sandra D
Home Financials for this Owner
Home Financials are based on the most recent Mortgage that was taken out on this home.
Original Mortgage
$70,000
Interest Rate
6.6%
Purchase Details
Closed on
Feb 6, 1998
Sold by
Buzbee Bruce and Buzbee Laura L
Bought by
Helland Frank
Home Financials for this Owner
Home Financials are based on the most recent Mortgage that was taken out on this home.
Original Mortgage
$259,250
Interest Rate
6.95%
Create a Home Valuation Report for This Property
The Home Valuation Report is an in-depth analysis detailing your home's value as well as a comparison with similar homes in the area
Home Values in the Area
Average Home Value in this Area
Purchase History
| Date | Buyer | Sale Price | Title Company |
|---|---|---|---|
| Simpson Family Trust | -- | None Listed On Document | |
| Simpson Craig B | -- | None Available | |
| Simpson Craig | -- | Pro Title & Escrow Inc | |
| Simpson Craig | -- | Pro Title & Escrow Inc | |
| Simpson Craig | -- | Pro Title And Escrow Inc | |
| Bastian Sid P | -- | None Available | |
| Simpson Craig | -- | Sundance Title Insurance Ag | |
| Ballard Jay A | -- | Sundance Title Ins Agency | |
| Helland Frank | -- | First American Title Co | |
| Helland Frank | -- | First American Title |
Source: Public Records
Mortgage History
| Date | Status | Borrower | Loan Amount |
|---|---|---|---|
| Previous Owner | Simpson Craig | $548,250 | |
| Previous Owner | Simpson Craig | $391,000 | |
| Previous Owner | Ballard Jay A | $275,000 | |
| Previous Owner | Helland Frank | $70,000 | |
| Previous Owner | Helland Frank | $259,250 |
Source: Public Records
Tax History
| Year | Tax Paid | Tax Assessment Tax Assessment Total Assessment is a certain percentage of the fair market value that is determined by local assessors to be the total taxable value of land and additions on the property. | Land | Improvement |
|---|---|---|---|---|
| 2025 | $7,401 | $773,510 | -- | -- |
| 2024 | $7,401 | $725,035 | $0 | $0 |
| 2023 | $7,532 | $742,480 | $0 | $0 |
| 2022 | $8,440 | $1,346,400 | $767,700 | $578,700 |
| 2021 | $6,514 | $874,600 | $429,000 | $445,600 |
| 2020 | $6,282 | $821,800 | $393,200 | $428,600 |
| 2019 | $5,718 | $756,900 | $383,200 | $373,700 |
| 2018 | $5,688 | $727,600 | $353,900 | $373,700 |
| 2017 | $5,178 | $386,555 | $0 | $0 |
| 2016 | $5,012 | $371,905 | $0 | $0 |
| 2015 | $4,856 | $358,155 | $0 | $0 |
| 2014 | $4,487 | $325,005 | $0 | $0 |
Source: Public Records
Map
Nearby Homes
- 2700 S Main St
- 748 Sierra View Dr
- 753 Sierra View Dr
- 2057 E Maple Hills Ln
- 550 N 2000 E
- 2116 S Valley View Dr Unit 58
- 737 N 1970 W Unit 347
- 2056 E Maple Hills Ln
- 3635 S Riverstone Rd E Unit 81
- 3755 S Mapleton Estates Dr E Unit 75
- 1378 E 1435 N Unit 7
- 3583 S Mapleton Dr Unit 13
- 1354 S 800 E
- 2771 W Aurora Ave S
- 567 N Legend Way Unit A/468
- 278 E Maple Ridge Rd S Unit 46
- 1352 E 1435 N Unit 6
- 120 E Magnolia Place Unit 1
- 644 S 1330 E
- 509 W 350 S Unit 30
Your Personal Tour Guide
Ask me questions while you tour the home.