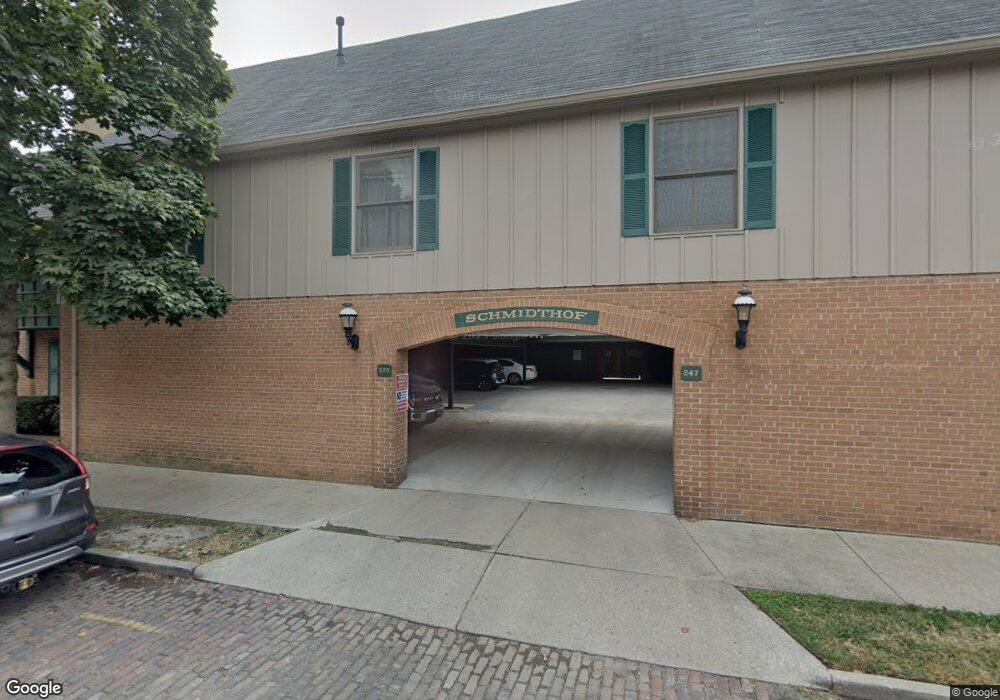
255 E Kossuth St Unit B Columbus, OH 43206
German Village NeighborhoodEstimated Value: $255,000 - $281,000
2
Beds
1
Bath
1,012
Sq Ft
$265/Sq Ft
Est. Value
About This Home
This home is located at 255 E Kossuth St Unit B, Columbus, OH 43206 and is currently estimated at $268,303, approximately $265 per square foot. 255 E Kossuth St Unit B is a home located in Franklin County with nearby schools including Siebert Elementary School, South High School, and South Columbus Preparatory Academy.
Ownership History
Date
Name
Owned For
Owner Type
Purchase Details
Closed on
Jan 30, 2020
Sold by
Freeman Frances L
Bought by
Freeman Frances L and Freeman John F
Current Estimated Value
Home Financials for this Owner
Home Financials are based on the most recent Mortgage that was taken out on this home.
Original Mortgage
$98,579
Interest Rate
3.74%
Mortgage Type
New Conventional
Purchase Details
Closed on
Aug 5, 2015
Sold by
Freeman John F and Freeman Frances L
Bought by
Freeman Frances L
Purchase Details
Closed on
Feb 18, 1997
Sold by
Cope Properties
Bought by
Freeman Frances L and Freeman John
Home Financials for this Owner
Home Financials are based on the most recent Mortgage that was taken out on this home.
Original Mortgage
$72,200
Interest Rate
7.74%
Mortgage Type
New Conventional
Purchase Details
Closed on
Aug 1, 1985
Create a Home Valuation Report for This Property
The Home Valuation Report is an in-depth analysis detailing your home's value as well as a comparison with similar homes in the area
Home Values in the Area
Average Home Value in this Area
Purchase History
| Date | Buyer | Sale Price | Title Company |
|---|---|---|---|
| Freeman Frances L | -- | Associates Title | |
| Freeman Frances L | -- | Attorney | |
| Freeman Frances L | $76,000 | -- | |
| -- | -- | -- |
Source: Public Records
Mortgage History
| Date | Status | Borrower | Loan Amount |
|---|---|---|---|
| Previous Owner | Freeman Frances L | $98,579 | |
| Previous Owner | Freeman Frances L | $72,200 |
Source: Public Records
Tax History
| Year | Tax Paid | Tax Assessment Tax Assessment Total Assessment is a certain percentage of the fair market value that is determined by local assessors to be the total taxable value of land and additions on the property. | Land | Improvement |
|---|---|---|---|---|
| 2025 | $2,952 | $75,570 | $18,200 | $57,370 |
| 2024 | $2,952 | $75,570 | $18,200 | $57,370 |
| 2023 | $2,942 | $75,565 | $18,200 | $57,365 |
| 2022 | $2,507 | $57,090 | $7,700 | $49,390 |
| 2021 | $2,512 | $57,090 | $7,700 | $49,390 |
| 2020 | $2,515 | $57,090 | $7,700 | $49,390 |
| 2019 | $2,618 | $51,910 | $7,000 | $44,910 |
| 2018 | $2,544 | $51,910 | $7,000 | $44,910 |
| 2017 | $2,617 | $51,910 | $7,000 | $44,910 |
| 2016 | $2,727 | $49,910 | $7,140 | $42,770 |
| 2015 | $2,475 | $49,910 | $7,140 | $42,770 |
| 2014 | $2,481 | $49,910 | $7,140 | $42,770 |
| 2013 | $1,153 | $47,530 | $6,790 | $40,740 |
Source: Public Records
Map
Nearby Homes
- 253 E Kossuth St Unit 253-H
- 243 E Whittier St Unit 245
- 320 E Columbus St
- 136 E Whittier St
- 831 S Lazelle St
- 135 E Whittier St
- 722 Mohawk St Unit 722
- 707 Sycamore Place Unit 707
- 242 E Sycamore St
- 432 E Kossuth St
- 186 E Sycamore St
- 639 S Grant Ave
- 1010 Bruck St
- 717 S 3rd St
- 626 Jaeger St Unit 7
- 279-281 E Beck St
- 616 S Grant Ave Unit 3B
- 46 E Frankfort St
- 472 E Whittier St
- 33 E Frankfort St
- 253 E Kossuth St Unit 253A
- 253 E Kossuth St Unit 253D
- 251 E Kossuth St
- 253 E Kossuth St
- 251 E Kossuth St Unit A
- 253 E Kossuth St
- 255 E Kossuth St
- 253 E Kossuth St Unit 253F
- 251 E Kossuth St
- 253 E Kossuth St
- 253 E Kossuth St
- 255 E Kossuth St
- 251 E Kossuth St
- 253 E Kossuth St Unit 253E
- 253 E Kossuth St Unit G
- 253 E Kossuth St Unit D
- 255 E Kossuth St Unit A
- 251 E Kossuth St Unit 251-A
- 251 E Kossuth St Unit B
- 253 E Kossuth St Unit A
Your Personal Tour Guide
Ask me questions while you tour the home.