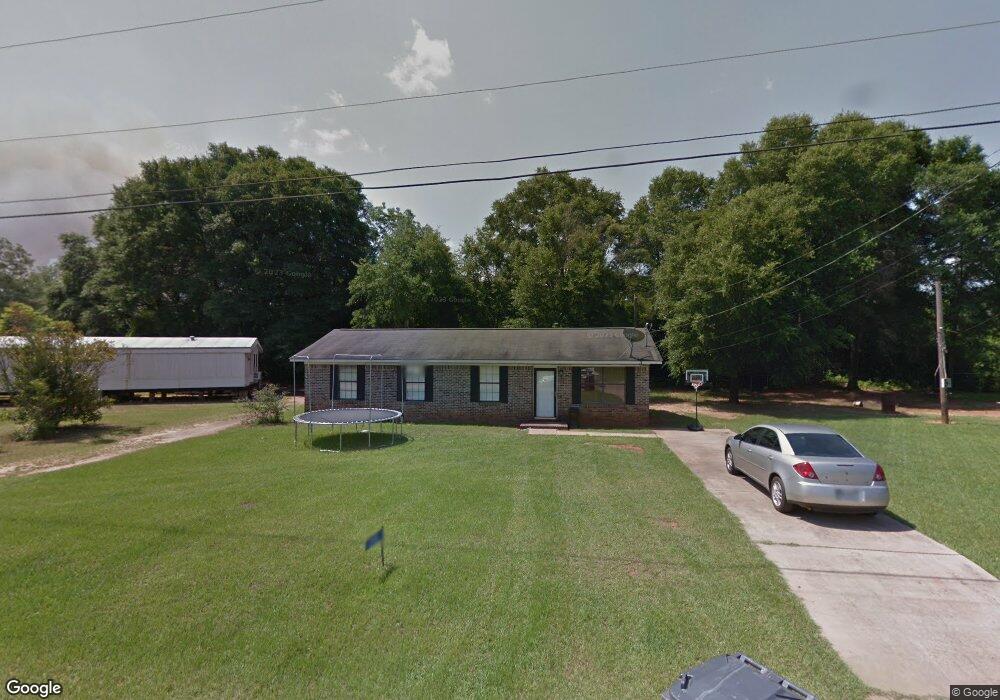
255 Mckenzie Dr Shellman, GA 39886
Estimated Value: $72,000 - $139,000
4
Beds
2
Baths
1,225
Sq Ft
$91/Sq Ft
Est. Value
About This Home
This home is located at 255 Mckenzie Dr, Shellman, GA 39886 and is currently estimated at $111,529, approximately $91 per square foot. 255 Mckenzie Dr is a home with nearby schools including Randolph County Elementary School, Randolph Clay Middle School, and Randolph Clay High School.
Ownership History
Date
Name
Owned For
Owner Type
Purchase Details
Closed on
Jun 7, 2007
Sold by
Pop & Knock Llc
Bought by
Johnson Destiny J
Current Estimated Value
Purchase Details
Closed on
Oct 4, 2005
Sold by
Usda Rural Development
Bought by
Pop & Knock Llc
Purchase Details
Closed on
May 26, 1999
Sold by
Bryan George Homes
Bought by
Lewis Mary L
Purchase Details
Closed on
Oct 7, 1997
Sold by
Lattimore Ben
Bought by
Bryan George Homes
Purchase Details
Closed on
Dec 9, 1994
Sold by
Mcdaniel Willie H
Bought by
Lattimore Ben
Purchase Details
Closed on
Feb 1, 1991
Bought by
Mcdaniel Willie H
Create a Home Valuation Report for This Property
The Home Valuation Report is an in-depth analysis detailing your home's value as well as a comparison with similar homes in the area
Home Values in the Area
Average Home Value in this Area
Purchase History
| Date | Buyer | Sale Price | Title Company |
|---|---|---|---|
| Johnson Destiny J | $59,500 | -- | |
| Johnson Destiny J | $59,500 | -- | |
| Pop & Knock Llc | -- | -- | |
| Pop & Knock Llc | -- | -- | |
| Lewis Mary L | $5,000 | -- | |
| Lewis Mary L | $5,000 | -- | |
| Bryan George Homes | $3,500 | -- | |
| Bryan George Homes | $3,500 | -- | |
| Lattimore Ben | $2,700 | -- | |
| Lattimore Ben | $2,700 | -- | |
| Mcdaniel Willie H | $3,200 | -- | |
| Mcdaniel Willie H | $3,200 | -- |
Source: Public Records
Tax History
| Year | Tax Paid | Tax Assessment Tax Assessment Total Assessment is a certain percentage of the fair market value that is determined by local assessors to be the total taxable value of land and additions on the property. | Land | Improvement |
|---|---|---|---|---|
| 2025 | $1,970 | $39,080 | $2,120 | $36,960 |
| 2024 | $1,986 | $36,600 | $1,960 | $34,640 |
| 2023 | $1,741 | $36,600 | $1,960 | $34,640 |
| 2022 | $1,764 | $36,600 | $1,960 | $34,640 |
| 2021 | $1,159 | $24,044 | $1,706 | $22,338 |
| 2020 | $920 | $24,044 | $1,706 | $22,338 |
| 2019 | $915 | $24,044 | $1,706 | $22,338 |
| 2018 | $1,137 | $24,044 | $1,706 | $22,338 |
| 2017 | $732 | $24,044 | $1,706 | $22,338 |
| 2016 | -- | $24,044 | $1,706 | $22,338 |
| 2015 | -- | $24,044 | $1,706 | $22,338 |
| 2014 | -- | $22,372 | $1,706 | $20,666 |
| 2013 | -- | $22,372 | $1,706 | $20,666 |
Source: Public Records
Map
Nearby Homes
- 48 Cheney St
- 3109 Calhoun St
- 3845 Pearl St
- 0 Carver St
- 8369 Graves Hwy
- Sam Bentley Rd
- Pierce Rd
- 0 Bird Song Rd
- 5147 Doverel Hwy
- 13XX Graves Hwy
- 00 Hwy 41
- 145 Pearson Dr SW
- 236 Gordon St SW
- 361/552 NW Tenth Ave
- 0 District Line Rd Unit 10518137
- 226 N Main St
- 411 E Lee St
- 300 Five Forks Rd
- 414 2nd Ave SE
- 527 Orange St NE
- 289 Mckenzie Dr
- 85 Pipkin St
- 21 Pipkin St
- 668 Division St
- 441 Mckenzie Dr
- 522 Division St
- 564 Division St
- 277 E Phelps St
- 289 E Phelps St
- 250 E Phelps St
- 360 Highland Ave
- 878 Division St
- 217 Cheney Ave
- 77 Pine St
- 228 E Phelps St
- 930 Division St
- 295 E Phelps St
- 208 Cheney Ave
- 986 Division St
- 214 E Phelps St
Your Personal Tour Guide
Ask me questions while you tour the home.