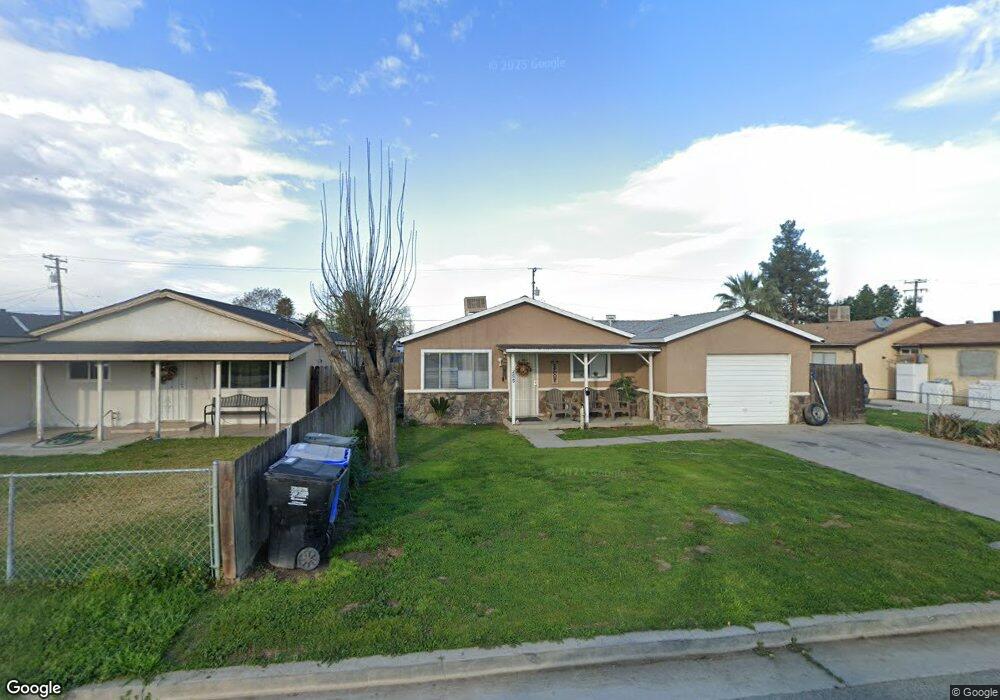
255 N Hamlin Rd Tipton, CA 93272
Estimated Value: $100,000 - $289,000
3
Beds
2
Baths
1,087
Sq Ft
$196/Sq Ft
Est. Value
About This Home
This home is located at 255 N Hamlin Rd, Tipton, CA 93272 and is currently estimated at $213,209, approximately $196 per square foot. 255 N Hamlin Rd is a home located in Tulare County with nearby schools including Tipton Elementary School, Palo Verde Elementary School, and Mission Oak High School.
Ownership History
Date
Name
Owned For
Owner Type
Purchase Details
Closed on
Feb 9, 2017
Sold by
Martin Francisco and Martin Blanca
Bought by
Francisco & Blanca Martin Living Trust
Current Estimated Value
Purchase Details
Closed on
Oct 4, 2016
Sold by
Stover Jerry L
Bought by
Martin Francisco and Martin Blanca
Home Financials for this Owner
Home Financials are based on the most recent Mortgage that was taken out on this home.
Original Mortgage
$50,000
Outstanding Balance
$40,046
Interest Rate
3.43%
Mortgage Type
Seller Take Back
Estimated Equity
$173,163
Purchase Details
Closed on
Aug 4, 2009
Sold by
Stover Jerry L
Bought by
Stover Jerry L and Jerry L Stover Revocable Living Trust
Purchase Details
Closed on
Apr 7, 2005
Sold by
Sullens Jess F
Bought by
Stover Jerry L
Purchase Details
Closed on
Feb 24, 2005
Sold by
Sullens Joyce M
Bought by
Sullens Jess F
Create a Home Valuation Report for This Property
The Home Valuation Report is an in-depth analysis detailing your home's value as well as a comparison with similar homes in the area
Home Values in the Area
Average Home Value in this Area
Purchase History
| Date | Buyer | Sale Price | Title Company |
|---|---|---|---|
| Francisco & Blanca Martin Living Trust | -- | None Available | |
| Martin Francisco | $55,000 | Chicago Title Company | |
| Stover Jerry L | -- | None Available | |
| Stover Jerry L | $60,000 | Fidelity Natl Title Co Of Ca | |
| Sullens Jess F | -- | Fidelity Natl Title Co Of Ca |
Source: Public Records
Mortgage History
| Date | Status | Borrower | Loan Amount |
|---|---|---|---|
| Open | Martin Francisco | $50,000 |
Source: Public Records
Tax History
| Year | Tax Paid | Tax Assessment Tax Assessment Total Assessment is a certain percentage of the fair market value that is determined by local assessors to be the total taxable value of land and additions on the property. | Land | Improvement |
|---|---|---|---|---|
| 2025 | $1,162 | $104,450 | $34,816 | $69,634 |
| 2024 | $1,162 | $102,403 | $34,134 | $68,269 |
| 2023 | $1,131 | $100,396 | $33,465 | $66,931 |
| 2022 | $1,099 | $98,428 | $32,809 | $65,619 |
| 2021 | $1,081 | $96,498 | $32,166 | $64,332 |
| 2020 | $1,108 | $95,508 | $31,836 | $63,672 |
| 2019 | $1,134 | $93,636 | $31,212 | $62,424 |
| 2018 | $1,115 | $91,800 | $30,600 | $61,200 |
| 2017 | $884 | $72,064 | $21,620 | $50,444 |
| 2016 | $846 | $70,651 | $21,196 | $49,455 |
| 2015 | $832 | $69,590 | $20,878 | $48,712 |
| 2014 | $798 | $68,227 | $20,469 | $47,758 |
Source: Public Records
Map
Nearby Homes
- 251 N Graham Rd
- 0 Avenue 144 Unit 231197
- 177 S Callison Rd
- 364 S Newman Rd
- 0 Ca-99 Unit 237484
- 0 Ca-99 Unit 202500357
- 12437 Avenue 176 Unit 176
- 10891 Avenue 120
- 10 Avenue 120
- 0 120 Ave Unit FR25132228
- 12394 Ave 184
- 0 Hwy 99 & Ave 184 Unit 11652531
- 0 Hwy 99 & Ave 184 Unit 238899
- 0 Hwy 99 & Ave 184 Unit 225153031
- 12394 Avenue 184
- 0 W Stanford Ave Unit 238175
- 821 E Stanford Ave
- 10351 Avenue 112
- 0 Road 112 Unit 202510708
- 0 Road 112 Unit 11681417
- 267 N Hamlin Rd
- 243 N Hamlin Rd
- 281 N Hamlin Rd
- 231 N Hamlin Rd
- 295 N Hamlin Rd
- 426 W Woods Ave
- 217 N Hamlin Rd
- 232 N La Fond Rd
- 0 Hamlin Rd
- 212 N La Fond Rd
- 191 S Hamlin Rd
- 188 N La Fond Rd
- 176 N La Fond Rd Unit 1
- 176 N La Fond Rd
- 221 S La Fond Rd
- 166 N La Fond Rd
- 465 W Woods Ave
- 151 S Hamlin Rd
- 156 N La Fond Rd
- 131 N Hamlin Rd
Your Personal Tour Guide
Ask me questions while you tour the home.