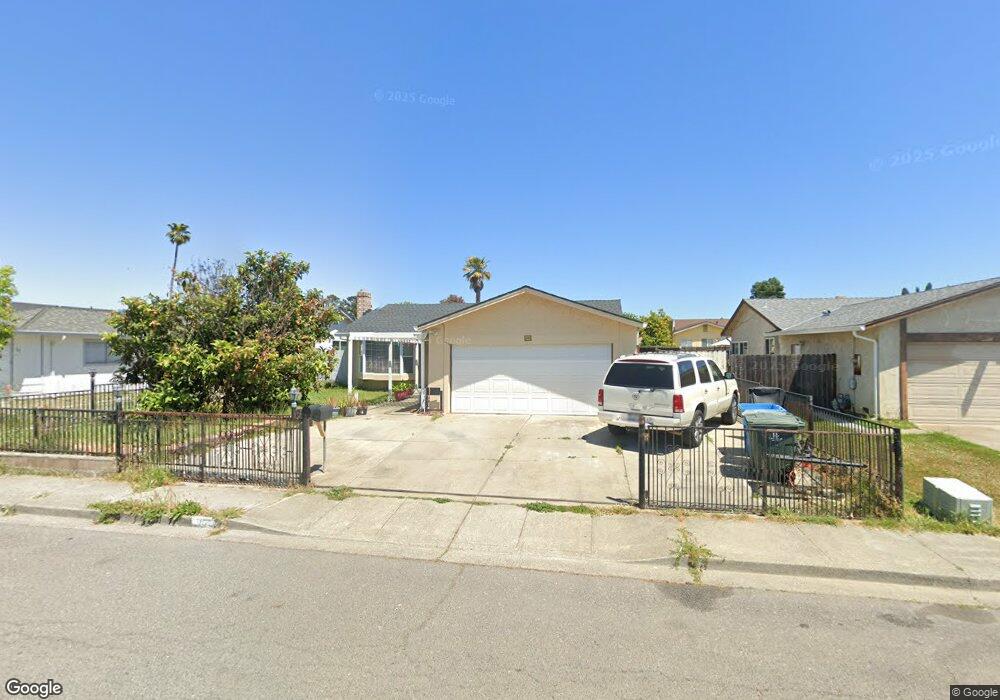
255 River Pines Way Vallejo, CA 94589
North Vallejo NeighborhoodEstimated Value: $356,000 - $519,000
3
Beds
2
Baths
1,144
Sq Ft
$389/Sq Ft
Est. Value
About This Home
This home is located at 255 River Pines Way, Vallejo, CA 94589 and is currently estimated at $445,189, approximately $389 per square foot. 255 River Pines Way is a home located in Solano County with nearby schools including Dan Mini Elementary School, Solano Middle School, and Vallejo High School.
Ownership History
Date
Name
Owned For
Owner Type
Purchase Details
Closed on
Jul 21, 2017
Sold by
Kong Joseph and Kong Joseph Kin Chun
Bought by
Kong Joseph and Kong Ying Tsang
Current Estimated Value
Purchase Details
Closed on
May 11, 2015
Sold by
Kong Ying Tsang
Bought by
Kong Joseph Kin Chun
Purchase Details
Closed on
May 6, 2015
Sold by
Baniqued Sheila M and Vicencio Pearl M
Bought by
Kong Joseph Kin Chun
Purchase Details
Closed on
Aug 3, 2007
Sold by
Vicencio Pearl M and Baniqued Sheila M
Bought by
Baniqued Sheila M and Vicencio Pearl M
Home Financials for this Owner
Home Financials are based on the most recent Mortgage that was taken out on this home.
Original Mortgage
$300,000
Interest Rate
6.65%
Mortgage Type
New Conventional
Purchase Details
Closed on
Jun 15, 2002
Sold by
Vicencio Edgardo L
Bought by
Vicencio Pearl M
Home Financials for this Owner
Home Financials are based on the most recent Mortgage that was taken out on this home.
Original Mortgage
$215,760
Interest Rate
5.88%
Purchase Details
Closed on
Jun 11, 2002
Sold by
Dionisio Pedro R and Dionisio Aurora O
Bought by
Vicencio Pearl M and Baniqued Sheila M
Home Financials for this Owner
Home Financials are based on the most recent Mortgage that was taken out on this home.
Original Mortgage
$215,760
Interest Rate
5.88%
Create a Home Valuation Report for This Property
The Home Valuation Report is an in-depth analysis detailing your home's value as well as a comparison with similar homes in the area
Home Values in the Area
Average Home Value in this Area
Purchase History
| Date | Buyer | Sale Price | Title Company |
|---|---|---|---|
| Kong Joseph | -- | None Available | |
| Kong Joseph Kin Chun | -- | Old Republic Title Company | |
| Kong Joseph Kin Chun | $188,500 | Old Republic Title Company | |
| Baniqued Sheila M | -- | Commonwealth Land Title Daly | |
| Vicencio Pearl M | -- | -- | |
| Vicencio Pearl M | $240,000 | Frontier Title Company |
Source: Public Records
Mortgage History
| Date | Status | Borrower | Loan Amount |
|---|---|---|---|
| Previous Owner | Baniqued Sheila M | $300,000 | |
| Previous Owner | Vicencio Pearl M | $215,760 |
Source: Public Records
Tax History Compared to Growth
Tax History
| Year | Tax Paid | Tax Assessment Tax Assessment Total Assessment is a certain percentage of the fair market value that is determined by local assessors to be the total taxable value of land and additions on the property. | Land | Improvement |
|---|---|---|---|---|
| 2025 | $3,643 | $226,540 | $84,123 | $142,417 |
| 2024 | $3,643 | $222,099 | $82,474 | $139,625 |
| 2023 | $3,414 | $217,745 | $80,857 | $136,888 |
| 2022 | $3,314 | $213,476 | $79,273 | $134,203 |
| 2021 | $3,240 | $209,291 | $77,719 | $131,572 |
| 2020 | $3,246 | $207,146 | $76,923 | $130,223 |
| 2019 | $3,139 | $203,085 | $75,415 | $127,670 |
| 2018 | $3,869 | $199,104 | $73,937 | $125,167 |
| 2017 | $2,965 | $195,201 | $72,488 | $122,713 |
| 2016 | $2,224 | $191,374 | $71,067 | $120,307 |
| 2015 | $2,748 | $237,000 | $59,000 | $178,000 |
| 2014 | -- | $183,000 | $46,000 | $137,000 |
Source: Public Records
Map
Nearby Homes
- 247 River Pines Way
- 263 River Pines Way
- 1365 Jack London Dr
- 271 River Pines Way
- 239 River Pines Way
- 1375 Jack London Dr
- 1355 Jack London Dr
- 1691 Severus Dr
- 1345 Jack London Dr
- 252 River Pines Way
- 244 River Pines Way
- 260 River Pines Way
- 231 River Pines Way
- 236 River Pines Way
- 268 River Pines Way
- 1335 Jack London Dr
- 223 River Pines Way
- 228 River Pines Way
- 1690 Severus Dr
- 1325 Jack London Dr