Estimated Value: $252,000 - $357,000
3
Beds
4
Baths
1,988
Sq Ft
$151/Sq Ft
Est. Value
About This Home
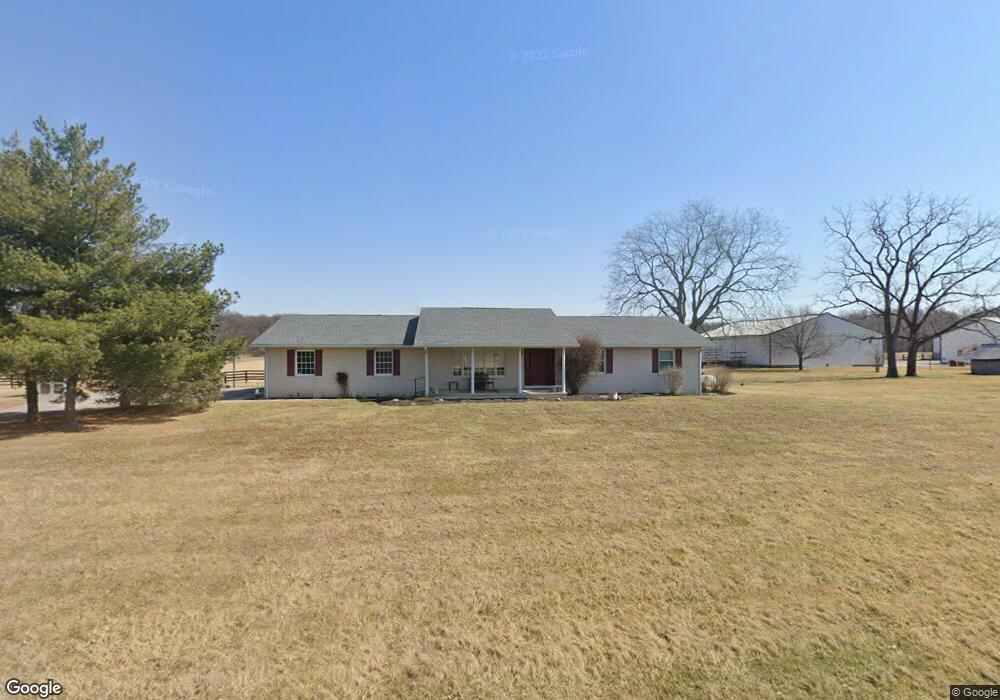
This home is located at 255 S Thayer Rd, Lima, OH 45806 and is currently estimated at $300,881, approximately $151 per square foot. 255 S Thayer Rd is a home located in Allen County with nearby schools including Bath Elementary School, Bath Middle School, and Bath High School.
Ownership History
Date
Name
Owned For
Owner Type
Purchase Details
Closed on
May 15, 2019
Sold by
Swallow Gary Lee and Swallow Janet A
Bought by
Swallow Robert E and Swallow Jodi
Current Estimated Value
Home Financials for this Owner
Home Financials are based on the most recent Mortgage that was taken out on this home.
Original Mortgage
$87,900
Outstanding Balance
$76,966
Interest Rate
4%
Mortgage Type
New Conventional
Estimated Equity
$223,915
Purchase Details
Closed on
Jun 13, 2014
Sold by
Mowery Sheryl Ann and Mowery Sheryl
Bought by
Swallow Gary Lee
Purchase Details
Closed on
Apr 1, 2014
Sold by
Colley Sheila J
Bought by
Mowery Sheryl
Purchase Details
Closed on
Jan 20, 1995
Sold by
Mowery Darrel
Bought by
Colley Sheila
Purchase Details
Closed on
Feb 8, 1988
Bought by
Mowery Sheryl Ann
Create a Home Valuation Report for This Property
The Home Valuation Report is an in-depth analysis detailing your home's value as well as a comparison with similar homes in the area
Purchase History
| Date | Buyer | Sale Price | Title Company |
|---|---|---|---|
| Swallow Robert E | $92,000 | None Available | |
| Swallow Gary Lee | $90,000 | None Available | |
| Mowery Sheryl | $97,800 | None Available | |
| Colley Sheila | $53,750 | -- | |
| Mowery Sheryl Ann | -- | -- |
Source: Public Records
Mortgage History
| Date | Status | Borrower | Loan Amount |
|---|---|---|---|
| Open | Swallow Robert E | $87,900 |
Source: Public Records
Tax History
| Year | Tax Paid | Tax Assessment Tax Assessment Total Assessment is a certain percentage of the fair market value that is determined by local assessors to be the total taxable value of land and additions on the property. | Land | Improvement |
|---|---|---|---|---|
| 2024 | $3,554 | $81,200 | $8,330 | $72,870 |
| 2023 | $3,101 | $68,810 | $7,070 | $61,740 |
| 2022 | $3,086 | $67,730 | $7,070 | $60,660 |
| 2021 | $3,096 | $67,730 | $7,070 | $60,660 |
| 2020 | $2,898 | $56,430 | $4,870 | $51,560 |
| 2019 | $2,898 | $56,430 | $4,870 | $51,560 |
| 2018 | $2,831 | $56,430 | $4,870 | $51,560 |
| 2017 | $2,493 | $49,710 | $4,870 | $44,840 |
| 2016 | $2,479 | $49,710 | $4,870 | $44,840 |
| 2015 | $2,646 | $49,710 | $4,870 | $44,840 |
| 2014 | $2,646 | $51,350 | $4,870 | $46,480 |
| 2013 | $2,708 | $51,350 | $4,870 | $46,480 |
Source: Public Records
Map
Nearby Homes
- 5606 Reservoir Rd
- 485 S Mumaugh Rd
- 3833 Harding Hwy
- 3774 Mount Vernon Place Unit C
- 3746 Armstead Place
- 303 Pinewood Cir
- 304 Pinewood Cir
- 32 Lakeside Dr
- 1855 S Cool Rd
- 221 Devonshire Dr
- 115 Oakview Ct
- 108 Valley Way
- 120 Barnsbury Dr
- 800 Heritage Dr
- 819 Canyon Dr
- 2525 Harding Hwy
- 125 Kensington Cir
- 5490 E Hanthorn Rd
- 5600 E Hanthorn Rd
- 4160 E Hanthorn Rd
- 465 S Thayer Rd
- 475 S Thayer Rd
- 574 S Thayer Rd
- 0000 Thayer Rd S
- 5060 Mowery Rd
- 620 S Thayer Rd
- 4729 Harding Hwy
- 666 S Thayer Rd
- 4867 Harding Hwy
- 5195 Mowery Rd
- 5270 Mowery Rd
- 5205 Mowery Rd
- 4677 Harding Hwy
- 4665 Harding Hwy
- 4643 Harding Hwy
- 4966 Reservoir Rd
- 4565 Harding Hwy
- 5120 Harding Hwy
- 5350 Mowery Rd
Your Personal Tour Guide
Ask me questions while you tour the home.