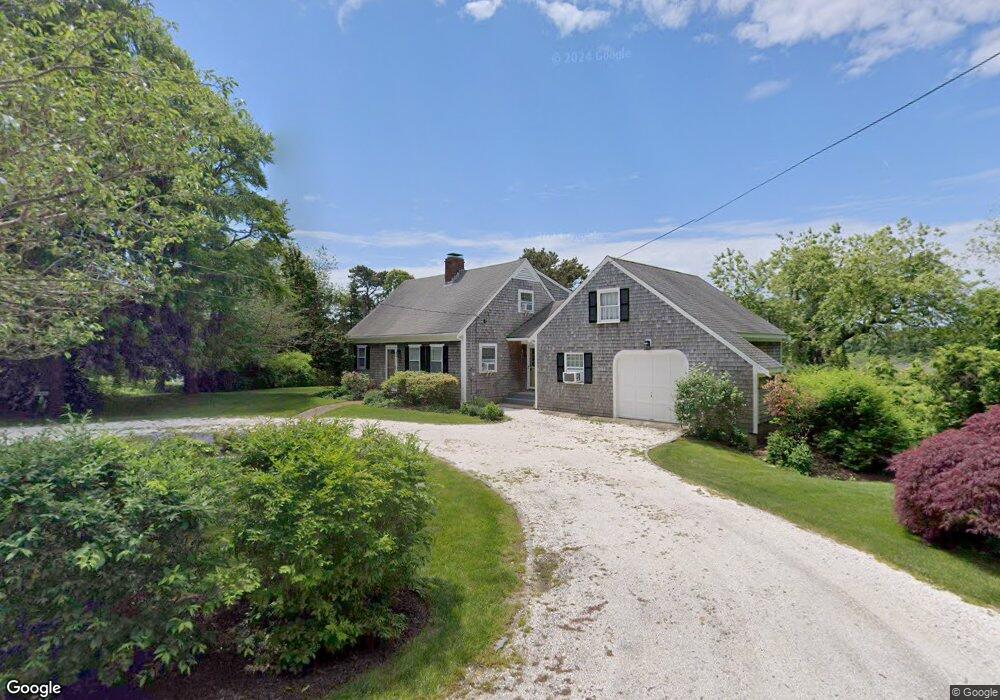
255 Stoney Point Rd Barnstable, MA 2630
Barnstable Village NeighborhoodEstimated Value: $1,007,317 - $1,510,000
3
Beds
2
Baths
1,964
Sq Ft
$636/Sq Ft
Est. Value
About This Home
This home is located at 255 Stoney Point Rd, Barnstable, MA 2630 and is currently estimated at $1,248,829, approximately $635 per square foot. 255 Stoney Point Rd is a home located in Barnstable County with nearby schools including West Barnstable Elementary School, Barnstable United Elementary School, and Barnstable Intermediate School.
Ownership History
Date
Name
Owned For
Owner Type
Purchase Details
Closed on
Feb 10, 2025
Sold by
Craig E Stewart T E and Craig Stewart
Bought by
Stewart Ft and Kolz-Griffin
Current Estimated Value
Purchase Details
Closed on
Aug 19, 2022
Sold by
Stewart Craig E and Bartley Sharon A
Bought by
Sharon A Bartley 2014 Ret and Stewart
Purchase Details
Closed on
Oct 23, 2007
Sold by
Cosden Christine E and Zeller Tracy J
Bought by
Stewart Craig E and Bartley Sharon A
Home Financials for this Owner
Home Financials are based on the most recent Mortgage that was taken out on this home.
Original Mortgage
$417,000
Interest Rate
6.51%
Mortgage Type
Purchase Money Mortgage
Create a Home Valuation Report for This Property
The Home Valuation Report is an in-depth analysis detailing your home's value as well as a comparison with similar homes in the area
Home Values in the Area
Average Home Value in this Area
Purchase History
| Date | Buyer | Sale Price | Title Company |
|---|---|---|---|
| Stewart Ft | -- | None Available | |
| Stewart Ft | -- | None Available | |
| Sharon A Bartley 2014 Ret | -- | None Available | |
| Sharon A Bartley 2014 Ret | -- | None Available | |
| Stewart Craig E | $585,000 | -- | |
| Stewart Craig E | $585,000 | -- |
Source: Public Records
Mortgage History
| Date | Status | Borrower | Loan Amount |
|---|---|---|---|
| Previous Owner | Stewart Craig E | $401,500 | |
| Previous Owner | Stewart Craig E | $417,000 |
Source: Public Records
Tax History
| Year | Tax Paid | Tax Assessment Tax Assessment Total Assessment is a certain percentage of the fair market value that is determined by local assessors to be the total taxable value of land and additions on the property. | Land | Improvement |
|---|---|---|---|---|
| 2025 | $8,967 | $970,500 | $544,600 | $425,900 |
| 2024 | $8,301 | $947,600 | $544,600 | $403,000 |
| 2023 | $6,650 | $740,500 | $383,300 | $357,200 |
| 2022 | $7,017 | $628,800 | $325,400 | $303,400 |
| 2021 | $6,628 | $566,000 | $295,800 | $270,200 |
| 2020 | $6,759 | $551,300 | $295,800 | $255,500 |
| 2019 | $6,384 | $522,400 | $295,800 | $226,600 |
| 2018 | $6,554 | $521,000 | $323,800 | $197,200 |
| 2017 | $6,549 | $523,900 | $336,300 | $187,600 |
| 2016 | $6,441 | $522,400 | $334,800 | $187,600 |
| 2015 | $6,376 | $526,500 | $333,500 | $193,000 |
Source: Public Records
Map
Nearby Homes
- 30 Indian Trail
- 79 Bayberry Ln
- 3528 Main St
- 4390 Main St
- 44 Iris Ln
- 41 Dromoland Ln
- 18 Sleeping Dog Path
- 65 Oakmont Rd
- 0 Indian Trail
- 162 Route 6a
- 100 Spy Glass Hill Rd
- 186 Route 6a
- 81 Desert Sands Ln
- 93 Harris Meadow Ln
- 69 Allyn Ln
- 0 Phinneys Ln
- 2656 Main St
- 28 Mariners Ln
- 11 Shepherds Way
- 933-935 W Yarmouth Rd
- 225 Stoney Point Rd
- 275 Stoney Point Rd
- 241 Bone Hill Rd
- 283 Bone Hill Rd
- 347 Bone Hill Rd
- 308 Bone Hill Rd
- 304 Bone Hill Rd
- 340 Bone Hill Rd
- 255 Bone Hill Rd
- 332 Bone Hill Rd
- 312 Bone Hill Rd
- 205 Stoney Point Rd
- 161 Harbor Point Rd
- 115 Harbor Point Rd
- 129 Harbor Point Rd
- 141 Harbor Point Rd
- 26 Tisquantum Rd
- 70 van Duzer Rd
- 106 van Duzer Rd
- 136 Harbor Point Rd
Your Personal Tour Guide
Ask me questions while you tour the home.