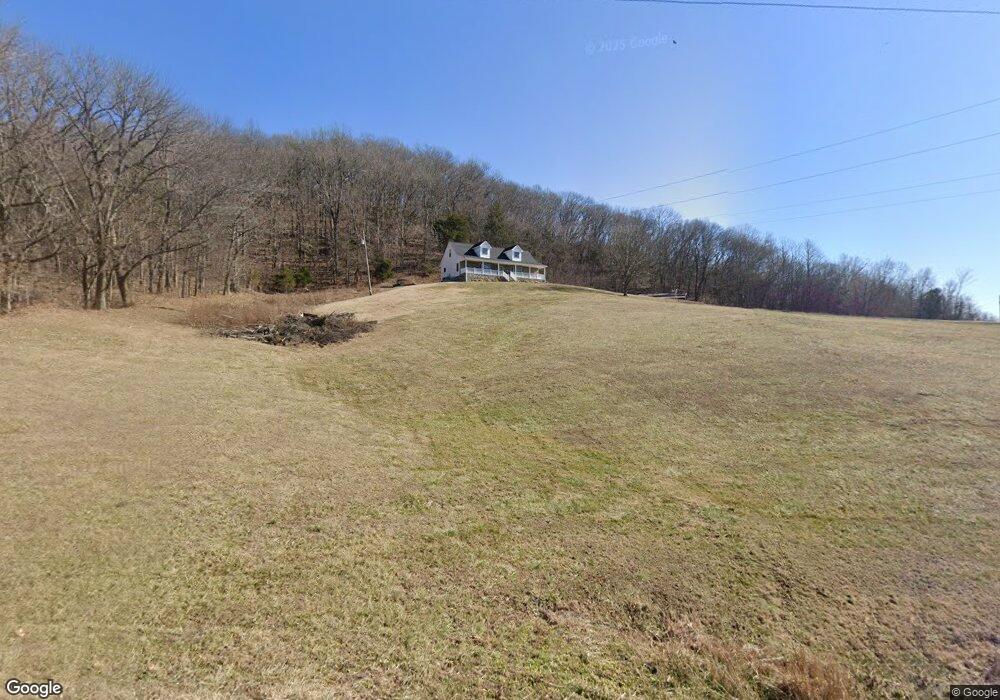
255 Templow Rd Bethpage, TN 37022
Estimated Value: $343,000 - $566,000
Studio
2
Baths
2,038
Sq Ft
$217/Sq Ft
Est. Value
About This Home
This home is located at 255 Templow Rd, Bethpage, TN 37022 and is currently estimated at $441,253, approximately $216 per square foot. 255 Templow Rd is a home located in Trousdale County with nearby schools including Trousdale County Elementary School, Trousdale County High School, and Jim Satterfield Middle School.
Ownership History
Date
Name
Owned For
Owner Type
Purchase Details
Closed on
Mar 1, 2021
Sold by
Carter Melissa A and Snow Richard E
Bought by
Griggs Nathan R
Current Estimated Value
Home Financials for this Owner
Home Financials are based on the most recent Mortgage that was taken out on this home.
Original Mortgage
$152,000
Outstanding Balance
$135,325
Interest Rate
2.7%
Mortgage Type
New Conventional
Estimated Equity
$305,928
Purchase Details
Closed on
Aug 5, 2005
Bought by
Snow Richard E
Purchase Details
Closed on
Mar 30, 1995
Sold by
Guernsey Mary E
Bought by
Richard Snow
Purchase Details
Closed on
Mar 26, 1992
Bought by
Guernsey Mary E
Purchase Details
Closed on
Feb 21, 1992
Bought by
Winesette Frank G and Winesette Mary E
Purchase Details
Closed on
Aug 14, 1986
Bought by
Draper Barry and Draper Delores
Purchase Details
Closed on
Sep 26, 1983
Create a Home Valuation Report for This Property
The Home Valuation Report is an in-depth analysis detailing your home's value as well as a comparison with similar homes in the area
Home Values in the Area
Average Home Value in this Area
Purchase History
| Date | Buyer | Sale Price | Title Company |
|---|---|---|---|
| Griggs Nathan R | $190,000 | Highland Title Llc | |
| Snow Richard E | $22,000 | -- | |
| Richard Snow | $34,900 | -- | |
| Guernsey Mary E | $1,000 | -- | |
| Winesette Frank G | $22,000 | -- | |
| Draper Barry | -- | -- | |
| -- | -- | -- |
Source: Public Records
Mortgage History
| Date | Status | Borrower | Loan Amount |
|---|---|---|---|
| Open | Griggs Nathan R | $152,000 |
Source: Public Records
Tax History Compared to Growth
Tax History
| Year | Tax Paid | Tax Assessment Tax Assessment Total Assessment is a certain percentage of the fair market value that is determined by local assessors to be the total taxable value of land and additions on the property. | Land | Improvement |
|---|---|---|---|---|
| 2025 | $1,688 | $82,000 | $0 | $0 |
| 2024 | $1,688 | $82,000 | $20,000 | $62,000 |
| 2023 | $1,597 | $82,000 | $20,000 | $62,000 |
| 2022 | $1,589 | $82,000 | $20,000 | $62,000 |
| 2021 | $1,471 | $82,000 | $20,000 | $62,000 |
| 2020 | $1,471 | $60,325 | $11,800 | $48,525 |
| 2019 | $1,471 | $60,325 | $11,800 | $48,525 |
| 2018 | $1,425 | $48,650 | $10,525 | $38,125 |
| 2017 | $1,384 | $48,650 | $10,525 | $38,125 |
| 2016 | $1,412 | $48,175 | $10,525 | $37,650 |
| 2015 | $1,503 | $48,175 | $10,525 | $37,650 |
| 2014 | $1,433 | $45,925 | $10,525 | $35,400 |
Source: Public Records
Map
Nearby Homes
- 0 Templow Rd Unit RTC3060361
- 4205 Browning Branch Rd
- 440 Honeysuckle Lane Rd
- 2 Hog Hollow Rd
- 7 Templow Rd
- 0 Browning Branch Rd Unit RTC3072769
- 1495 Wolf Hill Rd
- 2965 Sulphur College Rd
- 145 Crenshaw Rd
- 1061 Scott Rd
- 1071 Scott Rd
- 100 Ladybug Ln
- 1645 Sulphur College Rd
- 1705 Sulphur College Rd
- 1675 Sulphur College Rd
- 1775 Sulphur College Rd
- 1815 Sulphur College Rd
- 210 Crenshaw Rd
- 0 Highway 231 N Unit RTC3098370
- 0 Highway 231 N Unit RTC3072777
- 250 Templow Rd
- 360 Templow Rd
- 405 Templow Rd
- 470 Templow Rd
- 20 Templow Rd
- 0 Templow Rd Unit RTC2615177
- 0 Templow Rd Unit RTC2549796
- 0 Templow Rd Unit RTC2507308
- 0 Templow Rd Unit RTC2473169
- 0 Templow Rd Unit RTC2389519
- 0 Templow Rd Unit RTC2345533
- 0 Templow Rd Unit 2245281
- 4900 Browning Branch Rd
- 440 Templow Rd
- 485 Templow Rd
- 200 Templow Rd
- 575 Templow Rd
- 3335 Browning Branch Rd
- 3685 Browning Branch Rd
- 3705 Browning Branch Rd