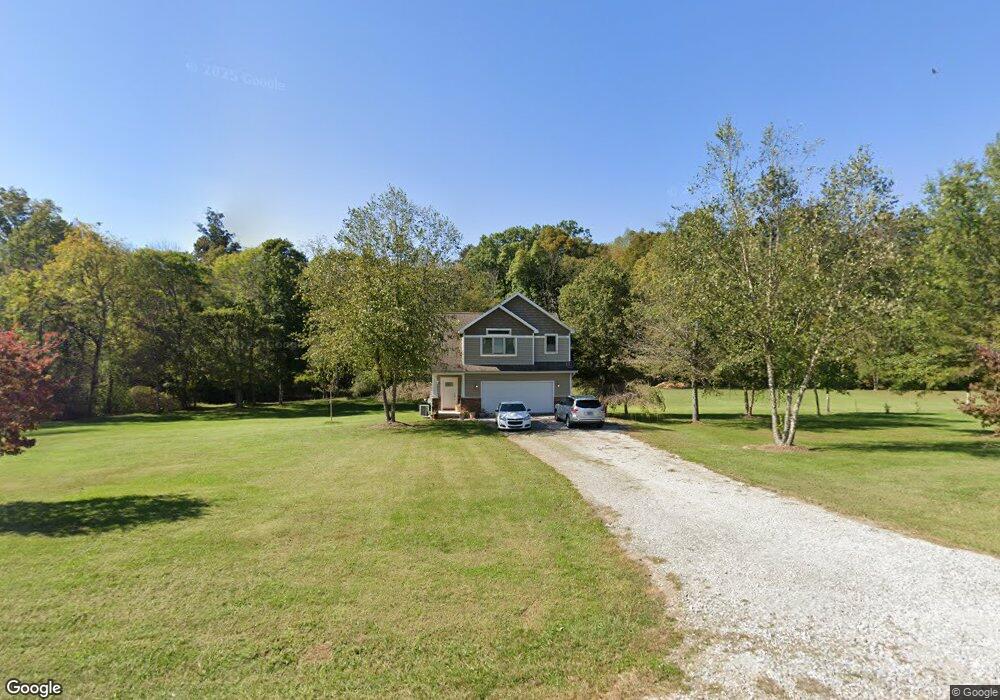
2550 Watermill Rd Cookeville, TN 38501
Estimated Value: $203,000 - $456,790
3
Beds
2
Baths
764
Sq Ft
$405/Sq Ft
Est. Value
About This Home
This home is located at 2550 Watermill Rd, Cookeville, TN 38501 and is currently estimated at $309,698, approximately $405 per square foot. 2550 Watermill Rd is a home with nearby schools including Cane Creek Elementary School, Upperman Middle School, and Upperman High School.
Ownership History
Date
Name
Owned For
Owner Type
Purchase Details
Closed on
Jul 18, 2025
Sold by
Rial Johnny Ray and Rial Amanda Sue
Bought by
Rial Real Estate Trust and Rial
Current Estimated Value
Purchase Details
Closed on
Apr 11, 2023
Sold by
Rial Johnny Ray
Bought by
Rial Johnny Ray and Rial Amanda Sue
Purchase Details
Closed on
Jun 5, 2009
Sold by
Mullins Michael A
Bought by
Rial Johnny Ray
Purchase Details
Closed on
Nov 24, 2008
Sold by
Mullins Michael
Bought by
Chaffin Dennis
Purchase Details
Closed on
Nov 4, 2008
Sold by
Mullins Michael A
Bought by
Mcbroom Dwain
Purchase Details
Closed on
Apr 10, 2000
Sold by
Laurel Kuykendall
Bought by
Mullins Michael A
Purchase Details
Closed on
Apr 3, 1986
Bought by
Mullins Michael A
Purchase Details
Closed on
Apr 10, 1948
Bought by
Kuykendall Laurel
Create a Home Valuation Report for This Property
The Home Valuation Report is an in-depth analysis detailing your home's value as well as a comparison with similar homes in the area
Home Values in the Area
Average Home Value in this Area
Purchase History
| Date | Buyer | Sale Price | Title Company |
|---|---|---|---|
| Rial Real Estate Trust | -- | None Listed On Document | |
| Rial Real Estate Trust | -- | None Listed On Document | |
| Rial Real Estate Trust | -- | None Listed On Document | |
| Rial Johnny Ray | -- | None Listed On Document | |
| Rial Johnny Ray | $36,000 | -- | |
| Chaffin Dennis | $72,000 | -- | |
| Mcbroom Dwain | $116,175 | -- | |
| Chaffin Dennis | $37,425 | -- | |
| Mullins Michael A | -- | -- | |
| Mullins Michael A | -- | -- | |
| Kuykendall Laurel | -- | -- |
Source: Public Records
Tax History Compared to Growth
Tax History
| Year | Tax Paid | Tax Assessment Tax Assessment Total Assessment is a certain percentage of the fair market value that is determined by local assessors to be the total taxable value of land and additions on the property. | Land | Improvement |
|---|---|---|---|---|
| 2024 | $2,610 | $98,125 | $8,900 | $89,225 |
| 2023 | $2,610 | $98,125 | $8,900 | $89,225 |
| 2022 | $2,426 | $98,125 | $8,900 | $89,225 |
| 2021 | $2,426 | $98,125 | $8,900 | $89,225 |
| 2020 | $2,557 | $98,125 | $8,900 | $89,225 |
| 2019 | $2,557 | $87,375 | $8,900 | $78,475 |
| 2018 | $2,385 | $87,375 | $8,900 | $78,475 |
| 2017 | $2,385 | $87,375 | $8,900 | $78,475 |
| 2016 | $1,545 | $91,175 | $12,700 | $78,475 |
| 2015 | $896 | $31,950 | $12,700 | $19,250 |
| 2014 | $700 | $24,972 | $0 | $0 |
Source: Public Records
Map
Nearby Homes
- 2450 Whispering Oaks Ln
- 2618 Whispering Oak Ln
- 2694 Whispering Oaks Ln
- 2600 Whispering Oaks Ln
- 2636 Whispering Oaks Ln
- 2870 Autumn Woods Trail
- 2269 Plunk Whitson Rd
- 3815 Spurgeon Dr
- 3013 Tulip Ln
- 2895 Autumn Woods Trail
- 2770 Autumn Woods Trail
- 2617 Spring Arbor Ct
- 2312 Benjy Cir
- 4028 Winter Haven Dr
- 1764 Bouton Dr
- 1711 Creekside Dr
- 1775 Creekside Dr
- 3709 Poundstone Dr
- 4763 Cumby Rd
- 4746 Maple Shade Cir
- 2535 Watermill Rd
- 2545 Watermill Rd
- 2525 Watermill Rd
- 2555 Watermill Rd
- 2515 Watermill Rd
- 2565 Watermill Rd
- 2810 Pippin Rd
- 2575 Watermill Rd
- 2720 Pippin Rd
- 6.02AC Watermill Rd
- 2690 Pippin Rd
- 2585 Watermill Rd
- 2866 Pippin Rd
- 2660 Pippin Rd
- 2630 Pippin Rd
- 2603 Watermill Rd
- 2471 Whispering Oaks Ln
- 2600 Pippin Rd
- 2489 Whispering Oaks Ln
- 2570 Pippin Rd