2551 Apple Valley Dr Howard, OH 43028
Apple Valley NeighborhoodEstimated Value: $268,000 - $304,017
3
Beds
4
Baths
1,696
Sq Ft
$170/Sq Ft
Est. Value
About This Home
This home is located at 2551 Apple Valley Dr, Howard, OH 43028 and is currently estimated at $289,004, approximately $170 per square foot. 2551 Apple Valley Dr is a home located in Knox County with nearby schools including East Knox Elementary School and East Knox High School.
Ownership History
Date
Name
Owned For
Owner Type
Purchase Details
Closed on
Jun 15, 2011
Sold by
Brown Valerie A and Brown Valerie A
Bought by
Morey Derek D and Morey Megan A
Current Estimated Value
Home Financials for this Owner
Home Financials are based on the most recent Mortgage that was taken out on this home.
Original Mortgage
$133,678
Outstanding Balance
$92,155
Interest Rate
4.63%
Mortgage Type
New Conventional
Estimated Equity
$196,849
Purchase Details
Closed on
Apr 15, 2005
Sold by
Mccomas Jason B and Mccomas Tiffany
Bought by
Brown Valerie A
Home Financials for this Owner
Home Financials are based on the most recent Mortgage that was taken out on this home.
Original Mortgage
$90,320
Interest Rate
6.06%
Mortgage Type
Purchase Money Mortgage
Purchase Details
Closed on
Feb 2, 2001
Sold by
Mccomas Herbert A and Mccomas Shery
Bought by
Mccomas Jason B
Purchase Details
Closed on
Jan 24, 2000
Sold by
Schnell Douglas W and Schnell Candy
Bought by
Mccomas Herbert A and Mccomas Shery
Create a Home Valuation Report for This Property
The Home Valuation Report is an in-depth analysis detailing your home's value as well as a comparison with similar homes in the area
Home Values in the Area
Average Home Value in this Area
Purchase History
| Date | Buyer | Sale Price | Title Company |
|---|---|---|---|
| Morey Derek D | $96,750 | None Available | |
| Brown Valerie A | $84,675 | None Available | |
| Mccomas Jason B | -- | -- | |
| Mccomas Herbert A | $3,000 | -- |
Source: Public Records
Mortgage History
| Date | Status | Borrower | Loan Amount |
|---|---|---|---|
| Open | Morey Derek D | $133,678 | |
| Previous Owner | Brown Valerie A | $90,320 |
Source: Public Records
Tax History
| Year | Tax Paid | Tax Assessment Tax Assessment Total Assessment is a certain percentage of the fair market value that is determined by local assessors to be the total taxable value of land and additions on the property. | Land | Improvement |
|---|---|---|---|---|
| 2024 | $2,690 | $67,510 | $3,860 | $63,650 |
| 2023 | $2,712 | $67,510 | $3,860 | $63,650 |
| 2022 | $2,608 | $55,790 | $3,190 | $52,600 |
| 2021 | $2,608 | $55,790 | $3,190 | $52,600 |
| 2020 | $2,418 | $54,300 | $3,190 | $51,110 |
| 2019 | $2,353 | $48,490 | $3,130 | $45,360 |
| 2018 | $2,203 | $48,490 | $3,130 | $45,360 |
| 2017 | $2,183 | $48,490 | $3,130 | $45,360 |
| 2016 | $2,052 | $44,900 | $2,900 | $42,000 |
| 2015 | $1,868 | $44,900 | $2,900 | $42,000 |
| 2014 | $1,871 | $44,900 | $2,900 | $42,000 |
| 2013 | $1,964 | $44,760 | $2,660 | $42,100 |
Source: Public Records
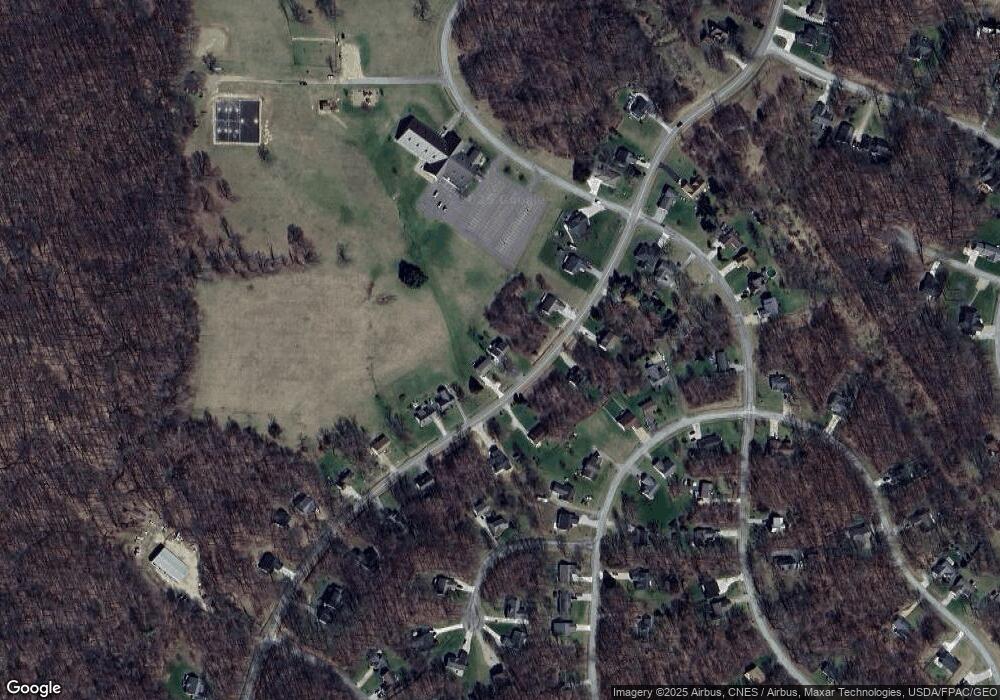
Map
Nearby Homes
- 0 Crestrose Dr Unit 20250705
- 0 Crestrose Dr Unit 20260088
- 0 Crestrose Dr Unit 226005244
- 487 Glenmonte Dr
- 711 Crestrose Cir
- 561 Glenmonte Dr
- 783 Crestrose Dr
- 381 N Ridge Heights Dr
- 381 Northridge Heights Dr
- 66 Valley Ct
- 410 Apple Hill Dr N
- 410 Apple Hill N
- 15066 Monroe Mills Rd
- 745 Valleywood Heights Dr
- 419 Highland Hills Cir
- 992 Country Club Dr
- 0 Valleyridge Dr Unit Lot 346
- 817 Highland Hills Dr
- 15014 Monroe Mills Rd
- 363 Highland Hills Cir
- 2547 Apple Valley Dr
- 2567 Apple Valley Dr
- 2539 Apple Valley Dr
- Lot 294 Floral Valley
- 2548 Apple Valley Dr
- 2560 Apple Valley Dr
- 2540 Apple Valley Dr
- 2568 Apple Valley Dr
- 2575 Apple Valley Dr
- 731 Daffodil Dr
- 723 Daffodil Dr
- 2576 Apple Valley Dr
- 735 Daffodil Dr
- 2527 Apple Valley Dr
- 2528 Apple Valley Dr
- 715 Daffodil Dr
- 860 Crestrose Dr
- 739 Daffodil Dr
- 15 Daisy Ct
- 812 Floral Valley Dr E
Your Personal Tour Guide
Ask me questions while you tour the home.