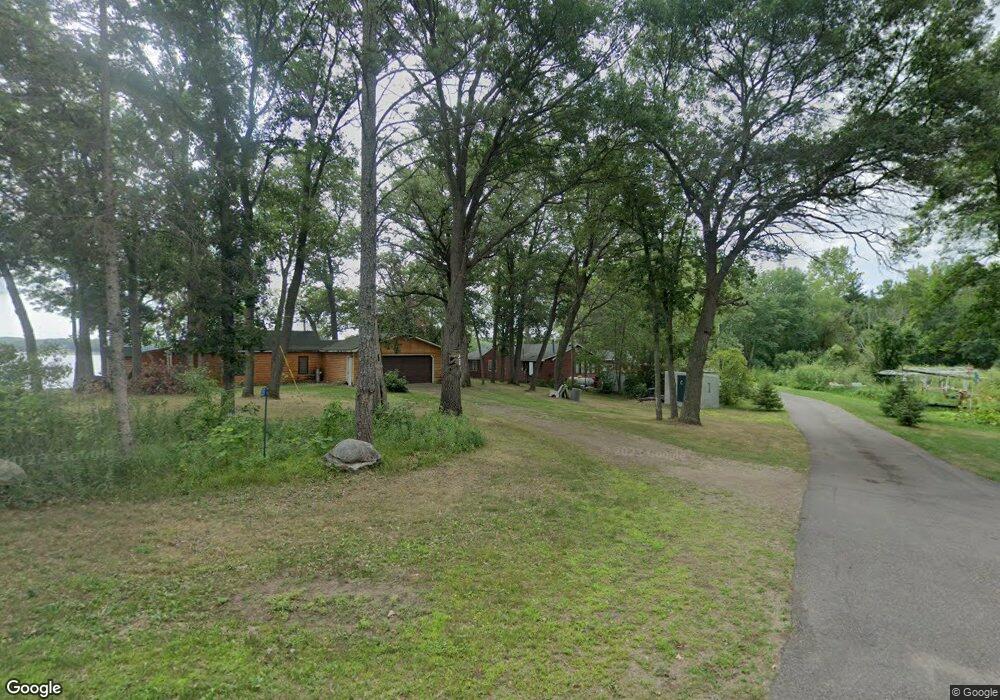
2551 Chippewa Shores Rd Brainerd, MN 56401
Estimated Value: $316,748 - $510,000
2
Beds
1
Bath
1,144
Sq Ft
$339/Sq Ft
Est. Value
About This Home
This home is located at 2551 Chippewa Shores Rd, Brainerd, MN 56401 and is currently estimated at $387,687, approximately $338 per square foot. 2551 Chippewa Shores Rd is a home located in Crow Wing County with nearby schools including Riverside Elementary School, Forestview Middle School, and Brainerd Senior High School.
Ownership History
Date
Name
Owned For
Owner Type
Purchase Details
Closed on
Dec 13, 2023
Sold by
Olson Craig C
Bought by
Craig C Olson Trust and Olson
Current Estimated Value
Purchase Details
Closed on
Jul 28, 2020
Sold by
Olson John H and Olson Susan A
Bought by
Olson John H Trust
Create a Home Valuation Report for This Property
The Home Valuation Report is an in-depth analysis detailing your home's value as well as a comparison with similar homes in the area
Home Values in the Area
Average Home Value in this Area
Purchase History
| Date | Buyer | Sale Price | Title Company |
|---|---|---|---|
| Craig C Olson Trust | $500 | None Listed On Document | |
| Olson John H Trust | $500 | Attorney Only |
Source: Public Records
Tax History Compared to Growth
Tax History
| Year | Tax Paid | Tax Assessment Tax Assessment Total Assessment is a certain percentage of the fair market value that is determined by local assessors to be the total taxable value of land and additions on the property. | Land | Improvement |
|---|---|---|---|---|
| 2025 | $1,790 | $248,900 | $132,600 | $116,300 |
| 2024 | $1,790 | $242,600 | $136,400 | $106,200 |
| 2023 | $1,600 | $228,700 | $125,000 | $103,700 |
| 2022 | $1,492 | $204,700 | $103,600 | $101,100 |
| 2021 | $1,314 | $147,200 | $84,600 | $62,600 |
| 2020 | $1,274 | $124,000 | $65,600 | $58,400 |
| 2019 | $1,088 | $123,500 | $65,600 | $57,900 |
| 2018 | $1,000 | $117,500 | $61,800 | $55,700 |
| 2017 | $952 | $95,530 | $46,561 | $48,969 |
| 2016 | $1,030 | $89,100 | $41,800 | $47,300 |
| 2015 | $1,188 | $104,100 | $51,600 | $52,500 |
| 2014 | $566 | $101,200 | $51,300 | $49,900 |
Source: Public Records
Map
Nearby Homes
- 5471 Crow Wing Lake Rd
- 8624- 50th Ave SW
- 2761 Mississippi Shores Rd
- TBD 4.38 Acres 13th Ave SW
- 13946 Hardy Lake Rd SW
- TBD State Highway 371
- TBD Timber Ridge Dr
- 13869 Hardy Lake Rd SW
- Tract B Richfield Rd
- Tract C Richfield Rd
- Tract A Richfield Rd
- 5688 Erin Rd
- TBD 263rd St
- 6440 Estate Dr
- 6207 Brandon Way
- 6740 Saint Mathias Rd
- 6724 Wels Ave
- 13384 Barnett Rd SW
- 6876 Wels Ave
- 7066 Wels Ave
- 2573 Chippewa Shores Rd
- 5510 Chippewa Ln
- 2591 Chippewa Shores Rd
- 2611 Chippewa Shores Rd
- 2611 Chippewa Shores Rd
- 2611 Chippewa Shores Rd
- 2617 Chippewa Shores Rd
- 2617 Chippewa Shores Rd
- 2631 Chippewa Shores Rd
- 2645 Chippewa Shore Rd
- 2645 2645 Chippewa Shore-Road-
- 2645 Chippewa Shores Rd
- 2655 Chippewa Shores Rd
- 5446 Chippewa Ln
- 2393 Crow Wing Camp Rd
- 2705 Chippewa Shores Rd
- 2715 Chippewa Shores Rd
- 2725 Chippewa Shore Rd
- 2749 Chippewa Shores Rd
- 5783 State Highway 371