2551 Davenport St SE Smyrna, GA 30080
Estimated Value: $259,000 - $374,399
3
Beds
2
Baths
1,200
Sq Ft
$272/Sq Ft
Est. Value
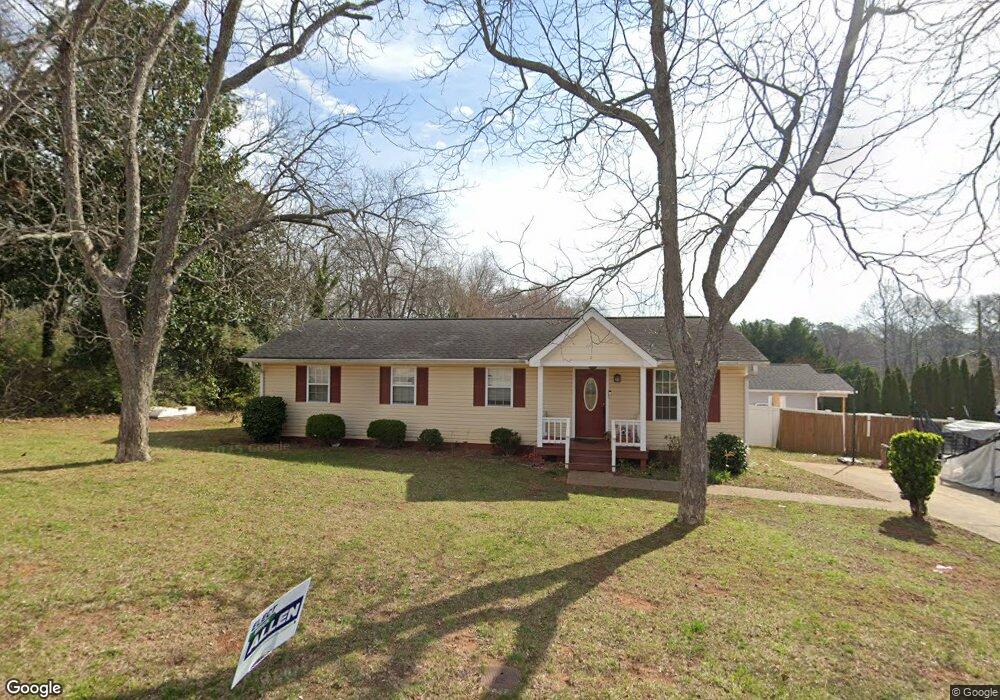
About This Home
This home is located at 2551 Davenport St SE, Smyrna, GA 30080 and is currently estimated at $326,100, approximately $271 per square foot. 2551 Davenport St SE is a home located in Cobb County with nearby schools including Smyrna Elementary School, Campbell Middle School, and Campbell High School.
Ownership History
Date
Name
Owned For
Owner Type
Purchase Details
Closed on
Dec 4, 2023
Sold by
Williams Frederick D and Williams Betty J
Bought by
Williams Betty J and Sims Jasma
Current Estimated Value
Purchase Details
Closed on
Oct 27, 2016
Sold by
Yerushalmi Brothers Diamonds U
Bought by
Williams Frederick D and Williams Betty J
Purchase Details
Closed on
Feb 10, 2015
Sold by
Anglo Holdings Limited Inc
Bought by
Yerushalmi Brothers Diamonds U
Purchase Details
Closed on
Nov 10, 2008
Sold by
Wells Fargo Bk Na
Bought by
Anglo Rlty Invest Partners Llc
Purchase Details
Closed on
Jun 3, 2008
Sold by
Quarles Spencer
Bought by
Wells Fargo Bk Na
Purchase Details
Closed on
Nov 14, 2003
Sold by
Parker Kim S
Bought by
Cobb Cnty Habitat Of Humanity Inc
Create a Home Valuation Report for This Property
The Home Valuation Report is an in-depth analysis detailing your home's value as well as a comparison with similar homes in the area
Home Values in the Area
Average Home Value in this Area
Purchase History
| Date | Buyer | Sale Price | Title Company |
|---|---|---|---|
| Williams Betty J | -- | None Listed On Document | |
| Williams Betty J | -- | None Listed On Document | |
| Williams Frederick D | $120,000 | -- | |
| Yerushalmi Brothers Diamonds U | $93,795 | -- | |
| Anglo Holdings Limited Inc | -- | -- | |
| Anglo Rlty Invest Partners Llc | $65,000 | -- | |
| Wells Fargo Bk Na | $112,061 | -- | |
| Cobb Cnty Habitat Of Humanity Inc | $5,000 | -- |
Source: Public Records
Tax History Compared to Growth
Tax History
| Year | Tax Paid | Tax Assessment Tax Assessment Total Assessment is a certain percentage of the fair market value that is determined by local assessors to be the total taxable value of land and additions on the property. | Land | Improvement |
|---|---|---|---|---|
| 2025 | $3,161 | $116,376 | $34,000 | $82,376 |
| 2024 | $3,161 | $116,376 | $34,000 | $82,376 |
| 2023 | $3,161 | $116,376 | $34,000 | $82,376 |
| 2022 | $2,142 | $78,300 | $20,000 | $58,300 |
| 2021 | $2,152 | $78,300 | $20,000 | $58,300 |
| 2020 | $1,668 | $60,672 | $20,000 | $40,672 |
| 2019 | $1,668 | $60,672 | $20,000 | $40,672 |
| 2018 | $1,152 | $41,912 | $14,000 | $27,912 |
| 2017 | $1,081 | $41,912 | $14,000 | $27,912 |
| 2016 | $967 | $37,496 | $9,896 | $27,600 |
| 2015 | $609 | $23,064 | $6,000 | $17,064 |
| 2014 | $615 | $23,064 | $0 | $0 |
Source: Public Records
Map
Nearby Homes
- 2590 Bates St SE
- 2654 Davenport St SE
- 2613 Davenport St SE
- 2627 Argo Dr SE
- 1537 Springleaf Cove SE
- 2683 Davenport St SE
- 1722 Wynndowne Trail SE
- 1704 Evenstad Way
- 2909 Ferrington Way
- 1700 Wynndowne Trail SE Unit C
- 1417 Springleaf Cir SE
- 1768 Evenstad Way
- 3037 Ferrington Way
- 1799 Timber Valley Way SE
- 1761 Whitfield Parc Cir SE
- 1764 Whitfield Parc Cir
- 2791 Madison St SE
- 2553 Bates St SE
- 2531 Davenport St SE
- 2555 Bates St SE
- 2557 Bates St SE
- 2560 Davenport St SE
- 2550 Bates St SE
- 2552 Bates St SE
- 2570 Davenport St SE
- 1786 Hawthorne Ave SE
- 2559 Bates St SE
- 2554 Bates St SE
- 1783 Hawthorne Avenue Smyrna 3008
- 1783 Hawthorne Ave SE
- 2521 Davenport St SE
- 2556 Bates St SE
- 1779 Hawthorne Ave SE
- 2561 Bates St SE
- 1775 Hawthorne Ave SE
- 00 Bates St SE
- 000 Bates St SE