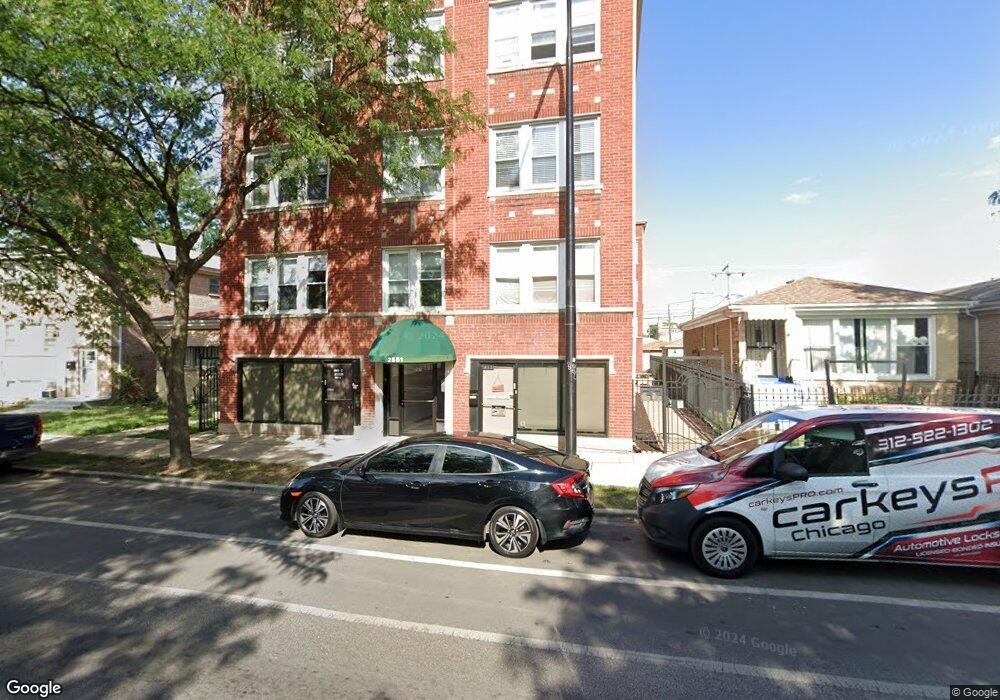
2551 N Laramie Ave Unit 25512N Chicago, IL 60639
Cragin NeighborhoodEstimated Value: $122,000 - $130,423
1
Bed
1
Bath
17,660
Sq Ft
$7/Sq Ft
Est. Value
About This Home
This home is located at 2551 N Laramie Ave Unit 25512N, Chicago, IL 60639 and is currently estimated at $127,356, approximately $7 per square foot. 2551 N Laramie Ave Unit 25512N is a home located in Cook County with nearby schools including Schubert Elementary School, Northwest Middle School, and Foreman College and Career Academy.
Ownership History
Date
Name
Owned For
Owner Type
Purchase Details
Closed on
Aug 7, 2023
Sold by
Hernandez Angelo
Bought by
Colon Julisa
Current Estimated Value
Home Financials for this Owner
Home Financials are based on the most recent Mortgage that was taken out on this home.
Original Mortgage
$99,910
Outstanding Balance
$97,556
Interest Rate
6.63%
Mortgage Type
New Conventional
Estimated Equity
$29,800
Purchase Details
Closed on
Jul 20, 2016
Sold by
Skorupa Mark
Bought by
Hemandez Angelo
Purchase Details
Closed on
Feb 26, 2016
Sold by
Resi Reo Sub Llc
Bought by
Arlp Reo Iii Llc
Purchase Details
Closed on
Sep 28, 2007
Sold by
S T Laramie Properties Llc
Bought by
Garcia Yesenia
Home Financials for this Owner
Home Financials are based on the most recent Mortgage that was taken out on this home.
Original Mortgage
$136,000
Interest Rate
6.49%
Mortgage Type
Purchase Money Mortgage
Create a Home Valuation Report for This Property
The Home Valuation Report is an in-depth analysis detailing your home's value as well as a comparison with similar homes in the area
Home Values in the Area
Average Home Value in this Area
Purchase History
| Date | Buyer | Sale Price | Title Company |
|---|---|---|---|
| Colon Julisa | $103,000 | Chicago Title | |
| Hemandez Angelo | $80,000 | Lakeland Title Services | |
| Arlp Reo Iii Llc | -- | Attorney | |
| Resi Reo Sub Llc | -- | Attorney | |
| Garcia Yesenia | $136,000 | Republic Title Co |
Source: Public Records
Mortgage History
| Date | Status | Borrower | Loan Amount |
|---|---|---|---|
| Open | Colon Julisa | $99,910 | |
| Previous Owner | Garcia Yesenia | $136,000 |
Source: Public Records
Tax History Compared to Growth
Tax History
| Year | Tax Paid | Tax Assessment Tax Assessment Total Assessment is a certain percentage of the fair market value that is determined by local assessors to be the total taxable value of land and additions on the property. | Land | Improvement |
|---|---|---|---|---|
| 2024 | $1,756 | $10,620 | $710 | $9,910 |
| 2023 | $1,711 | $8,322 | $576 | $7,746 |
| 2022 | $1,711 | $8,322 | $576 | $7,746 |
| 2021 | $1,673 | $8,321 | $575 | $7,746 |
| 2020 | $1,580 | $7,091 | $479 | $6,612 |
| 2019 | $1,607 | $7,998 | $479 | $7,519 |
| 2018 | $1,580 | $7,998 | $479 | $7,519 |
| 2017 | $1,157 | $5,376 | $422 | $4,954 |
| 2016 | $1,077 | $5,376 | $422 | $4,954 |
| 2015 | $985 | $5,376 | $422 | $4,954 |
| 2014 | $1,245 | $6,709 | $403 | $6,306 |
| 2013 | $1,220 | $6,709 | $403 | $6,306 |
Source: Public Records
Map
Nearby Homes
- 2511 N Laramie Ave
- 2455 N Laramie Ave
- 5108 W Wrightwood Ave
- 5205 W Drummond Place Unit 1
- 5243 W Fullerton Ave
- 2412 N Lorel Ave
- 5330 W Drummond Place
- 5233 W Parker Ave
- 4953 W Drummond Place
- 2515 N Lotus Ave
- 2503 N Lotus Ave
- 5121 W Diversey Ave Unit 3N
- 1910 N Lockwood Ave
- 4906 W Deming Place
- 4918-22 W Diversey Ave
- 2100 N Parkside Ave
- 4950 W Diversey Ave
- 5254 W Wolfram St
- 2218 N Lavergne Ave
- 5512 W Wrightwood Ave
- 2549 N Laramie Ave Unit 1W
- 2549 N Laramie Ave Unit 25491
- 2549 N Laramie Ave Unit 25491
- 2549 N Laramie Ave Unit 25491
- 2549 N Laramie Ave Unit 25493E
- 2549 N Laramie Ave Unit 25491W
- 2551 N Laramie Ave Unit 25513S
- 2549 N Laramie Ave Unit 25493W
- 2549 N Laramie Ave Unit 25492W
- 2549 N Laramie Ave Unit 25492E
- 2549 N Laramie Ave Unit 25491E
- 2551 N Laramie Ave Unit 25511N
- 2551 N Laramie Ave Unit 25512S
- 2551 N Laramie Ave Unit 25511S
- 2551 N Laramie Ave Unit 2S
- 2551 N Laramie Ave Unit 5
- 2551 N Laramie Ave Unit S
- 2551 N Laramie Ave Unit N
- 2549 N Laramie Ave Unit 1E
- 2549 N Laramie Ave Unit 2E