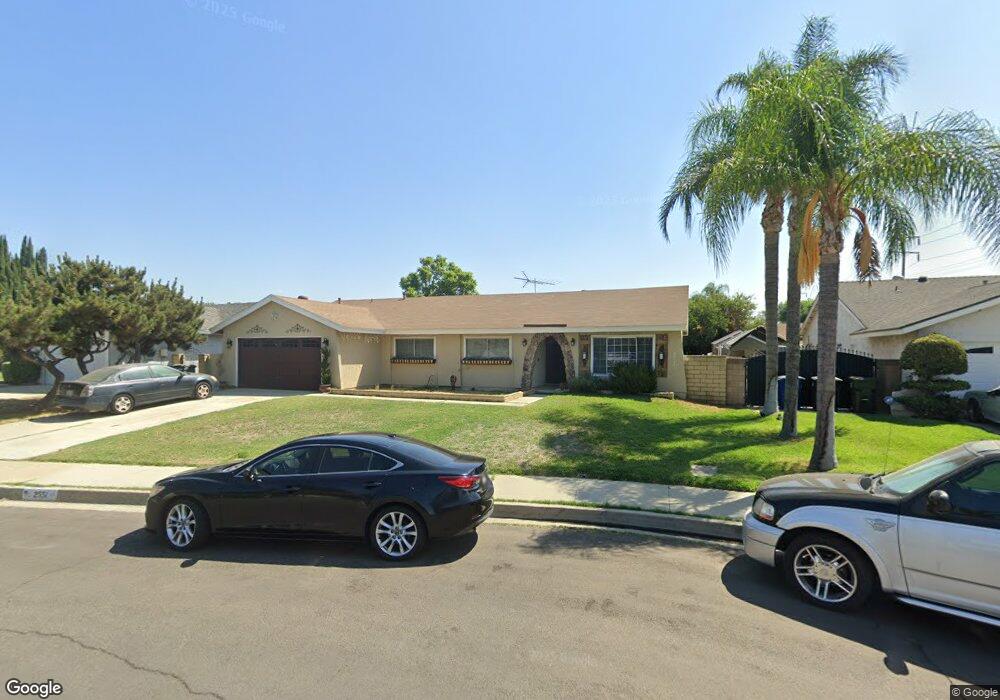
2551 S Phoenix Place Ontario, CA 91761
Downtown Ontario NeighborhoodEstimated Value: $663,115 - $730,000
4
Beds
2
Baths
1,524
Sq Ft
$463/Sq Ft
Est. Value
About This Home
This home is located at 2551 S Phoenix Place, Ontario, CA 91761 and is currently estimated at $705,529, approximately $462 per square foot. 2551 S Phoenix Place is a home located in San Bernardino County with nearby schools including Bon View Elementary, De Anza Middle, and Ontario High School.
Ownership History
Date
Name
Owned For
Owner Type
Purchase Details
Closed on
Nov 12, 2013
Sold by
Solis Tom P and Solis Yolanda C
Bought by
Solis Tom P and Solis Yolanda C
Current Estimated Value
Home Financials for this Owner
Home Financials are based on the most recent Mortgage that was taken out on this home.
Original Mortgage
$193,000
Outstanding Balance
$143,586
Interest Rate
4.17%
Mortgage Type
New Conventional
Estimated Equity
$561,943
Purchase Details
Closed on
Jan 6, 1999
Sold by
Va
Bought by
Beck Richard R and Beck Betty
Home Financials for this Owner
Home Financials are based on the most recent Mortgage that was taken out on this home.
Original Mortgage
$143,539
Interest Rate
6.63%
Mortgage Type
FHA
Purchase Details
Closed on
Dec 4, 1998
Sold by
Beck Richard R and Beck Betty
Bought by
Solis Thomas P and Solis Yolanda C
Home Financials for this Owner
Home Financials are based on the most recent Mortgage that was taken out on this home.
Original Mortgage
$143,539
Interest Rate
6.63%
Mortgage Type
FHA
Create a Home Valuation Report for This Property
The Home Valuation Report is an in-depth analysis detailing your home's value as well as a comparison with similar homes in the area
Home Values in the Area
Average Home Value in this Area
Purchase History
| Date | Buyer | Sale Price | Title Company |
|---|---|---|---|
| Solis Tom P | -- | En Title Insurance Company | |
| Beck Richard R | -- | Northern Counties Title Co | |
| Solis Thomas P | $144,500 | Northern Counties Title Co |
Source: Public Records
Mortgage History
| Date | Status | Borrower | Loan Amount |
|---|---|---|---|
| Open | Solis Tom P | $193,000 | |
| Previous Owner | Solis Thomas P | $143,539 |
Source: Public Records
Tax History Compared to Growth
Tax History
| Year | Tax Paid | Tax Assessment Tax Assessment Total Assessment is a certain percentage of the fair market value that is determined by local assessors to be the total taxable value of land and additions on the property. | Land | Improvement |
|---|---|---|---|---|
| 2025 | $2,418 | $226,544 | $79,174 | $147,370 |
| 2024 | $2,418 | $222,102 | $77,622 | $144,480 |
| 2023 | $2,351 | $217,747 | $76,100 | $141,647 |
| 2022 | $2,319 | $213,478 | $74,608 | $138,870 |
| 2021 | $2,303 | $209,292 | $73,145 | $136,147 |
| 2020 | $2,263 | $207,146 | $72,395 | $134,751 |
| 2019 | $2,243 | $203,084 | $70,975 | $132,109 |
| 2018 | $2,211 | $199,102 | $69,583 | $129,519 |
| 2017 | $2,132 | $195,198 | $68,219 | $126,979 |
| 2016 | $2,049 | $191,370 | $66,881 | $124,489 |
| 2015 | $2,035 | $188,495 | $65,876 | $122,619 |
| 2014 | $1,972 | $184,803 | $64,586 | $120,217 |
Source: Public Records
Map
Nearby Homes
- 2408 S Taylor Place
- 513 E Fairfield Ct
- 2437 S Garfield Place
- 1020 E Tam o Shanter Ct
- 4235 S Gasly Paseo
- 0 Vineyard Unit CV25067044
- 4245 S Grasly Paseo
- 4233 S Grasly Paseo
- 0 Phillips Unit CV23180894
- 2300 S Sultana Ave Unit 298
- 2919 S Caldwell Ave
- 2119 S Phoenix Place
- 2453 S Marigold Place
- 310 E Philadelphia St Unit 35
- 310 E Philadelphia St
- 2148 S Sultana Ave
- 2708 S Parkside Dr
- 114 Cormorant Dr
- 2030 S Bon View Ave Unit G
- 2001 S Campus Ave Unit 7F
- 2545 S Phoenix Place
- 2557 S Phoenix Place
- 2550 S Caldwell Ave
- 2544 S Caldwell Ave
- 2539 S Phoenix Place
- 2556 S Caldwell Ave
- 2538 S Caldwell Ave
- 2550 S Phoenix Place
- 2556 S Phoenix Place
- 2533 S Phoenix Place
- 2532 S Caldwell Ave
- 2538 S Phoenix Place
- 2527 S Phoenix Place
- 2532 S Phoenix Place
- 2526 S Caldwell Ave
- 2551 S Caldwell Ave
- 2557 S Caldwell Ave
- 2545 S Caldwell Ave
- 2539 S Caldwell Ave
- 2526 S Phoenix Place