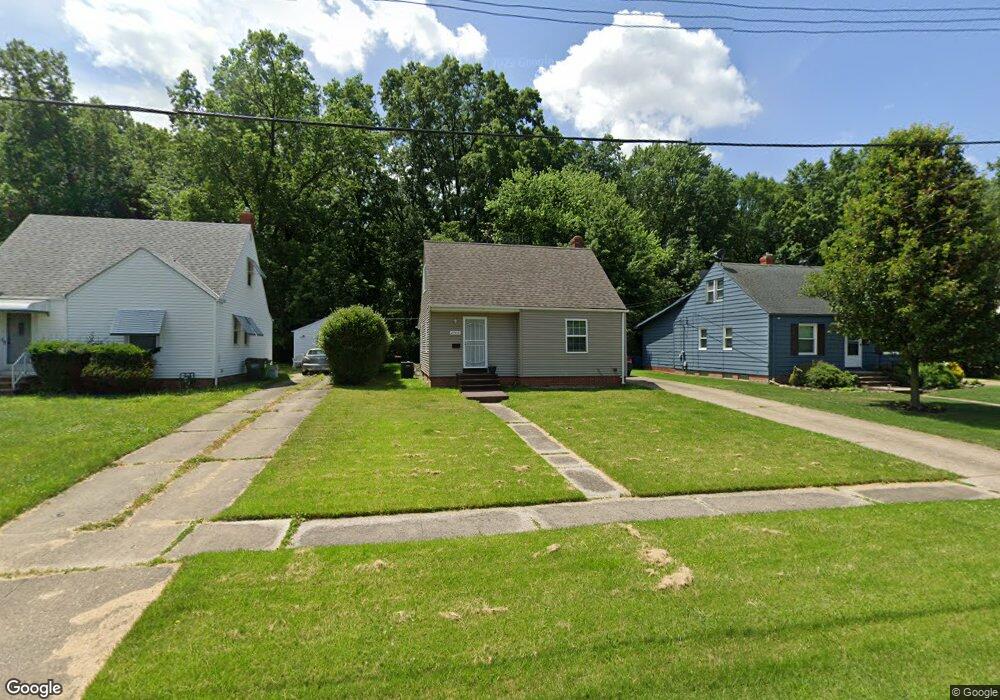
25510 Benton Ave Euclid, OH 44132
Estimated Value: $107,000 - $147,000
2
Beds
1
Bath
1,032
Sq Ft
$117/Sq Ft
Est. Value
About This Home
This home is located at 25510 Benton Ave, Euclid, OH 44132 and is currently estimated at $120,961, approximately $117 per square foot. 25510 Benton Ave is a home located in Cuyahoga County with nearby schools including Shoreview Elementary School, Euclid High School, and Pinnacle Academy.
Ownership History
Date
Name
Owned For
Owner Type
Purchase Details
Closed on
Apr 7, 2020
Sold by
Siegner John and Siegner Nora Lee
Bought by
Geller Properties Llc
Current Estimated Value
Purchase Details
Closed on
Jul 27, 2006
Sold by
Hud
Bought by
Siegner John
Purchase Details
Closed on
Aug 2, 2002
Sold by
Silbernagel Daniel M and Geiger Andrea D
Bought by
Hud
Purchase Details
Closed on
Sep 4, 1998
Sold by
Murphy Mary L and Murphy Chuck
Bought by
Silbernagel Daniel M and Silbernagel Andrea D
Home Financials for this Owner
Home Financials are based on the most recent Mortgage that was taken out on this home.
Original Mortgage
$60,900
Interest Rate
7.04%
Mortgage Type
FHA
Purchase Details
Closed on
Sep 11, 1975
Sold by
Murphy Frank J and Murphy Mary L
Bought by
Murphy Mary L
Purchase Details
Closed on
Jan 1, 1975
Bought by
Murphy Frank J and Murphy Mary L
Create a Home Valuation Report for This Property
The Home Valuation Report is an in-depth analysis detailing your home's value as well as a comparison with similar homes in the area
Home Values in the Area
Average Home Value in this Area
Purchase History
| Date | Buyer | Sale Price | Title Company |
|---|---|---|---|
| Geller Properties Llc | $20,500 | Titleco Title Agency Ltd | |
| Siegner John | $47,770 | Lakeside | |
| Hud | $46,667 | U S Title Agency | |
| Silbernagel Daniel M | $61,000 | Executive Title Agency Corp | |
| Murphy Mary L | -- | -- | |
| Murphy Frank J | -- | -- |
Source: Public Records
Mortgage History
| Date | Status | Borrower | Loan Amount |
|---|---|---|---|
| Previous Owner | Silbernagel Daniel M | $60,900 |
Source: Public Records
Tax History Compared to Growth
Tax History
| Year | Tax Paid | Tax Assessment Tax Assessment Total Assessment is a certain percentage of the fair market value that is determined by local assessors to be the total taxable value of land and additions on the property. | Land | Improvement |
|---|---|---|---|---|
| 2024 | $2,140 | $29,925 | $9,450 | $20,475 |
| 2023 | $1,691 | $18,520 | $6,790 | $11,730 |
| 2022 | $1,654 | $18,520 | $6,790 | $11,730 |
| 2021 | $1,838 | $18,520 | $6,790 | $11,730 |
| 2020 | $1,747 | $15,960 | $5,850 | $10,120 |
| 2019 | $1,569 | $45,600 | $16,700 | $28,900 |
| 2018 | $1,873 | $15,960 | $5,850 | $10,120 |
| 2017 | $2,329 | $20,030 | $4,870 | $15,160 |
| 2016 | $2,335 | $20,030 | $4,870 | $15,160 |
| 2015 | $2,131 | $20,030 | $4,870 | $15,160 |
| 2014 | $2,131 | $20,030 | $4,870 | $15,160 |
Source: Public Records
Map
Nearby Homes
- 861 E 256th St
- 825 E 256th St
- 754 E 256th St
- 720 E 254th St
- 833 E 250th St
- 820 E 250th St
- 795 E 260th St
- 26268 Leslie Ave
- 24330 Glenforest Rd
- 25390 Briardale Ave
- 25700 Briardale Ave
- 24451 Devoe Ave
- 25750 Drakefield Ave
- 860 E 245th St
- 640 E 261st St
- 635 E 261st St
- 25450 Farringdon Ave
- 780 E 266th St
- 26430 Drakefield Ave
- 23896 Devoe Ave
- 25540 Benton Ave
- 25470 Benton Ave
- 25570 Benton Ave
- 25440 Benton Ave
- 25610 Benton Ave
- 864 E 256th St
- 25410 Benton Ave
- 25640 Benton Ave
- 25370 Benton Ave
- 25670 Benton Ave
- 860 E 256th St
- 821 E 254th St
- 871 E 256th St
- 25710 Benton Ave
- 854 E 256th St
- 830 E 254th St
- 865 E 256th St
- 824 E 254th St
- 25740 Benton Ave
- 850 E 256th St