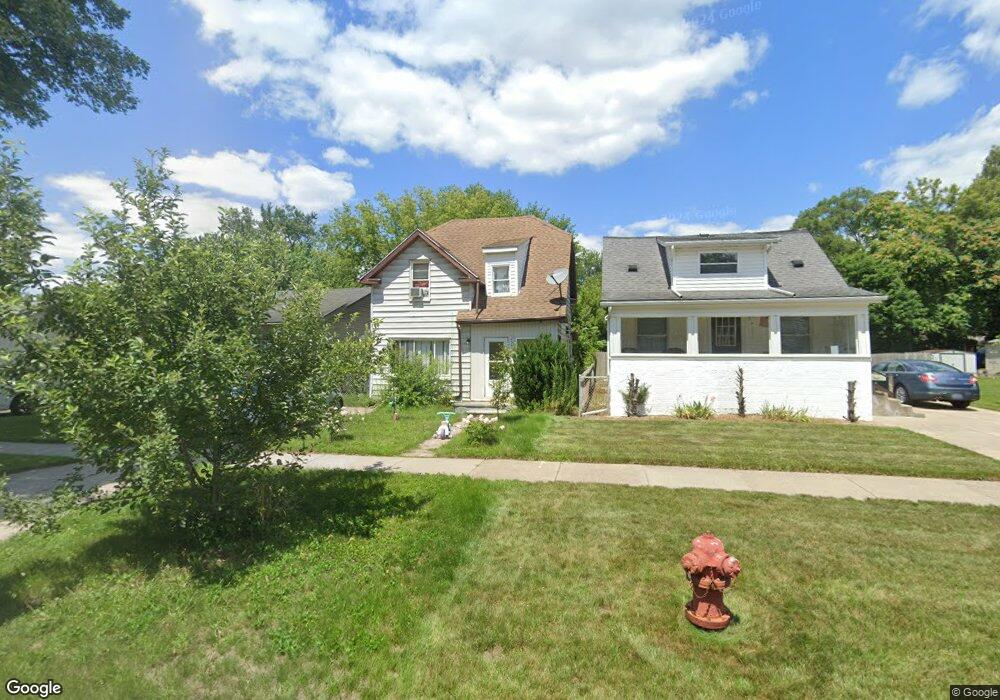
25520 New York St Unit Bldg-Unit Dearborn Heights, MI 48125
Estimated Value: $132,000 - $139,000
3
Beds
1
Bath
973
Sq Ft
$138/Sq Ft
Est. Value
About This Home
This home is located at 25520 New York St Unit Bldg-Unit, Dearborn Heights, MI 48125 and is currently estimated at $134,033, approximately $137 per square foot. 25520 New York St Unit Bldg-Unit is a home located in Wayne County with nearby schools including West Village Academy and Peterson-Warren Academy.
Ownership History
Date
Name
Owned For
Owner Type
Purchase Details
Closed on
Aug 4, 2023
Sold by
Al-Abid Mutaz A
Bought by
Al-Abed Bayada Quad-Harabed and Al-Arid Mutaz A
Current Estimated Value
Purchase Details
Closed on
Jul 15, 2019
Sold by
Gill Kewal S and Gill Sukhwant S
Bought by
Al Abid Mutaz A
Purchase Details
Closed on
Jun 17, 2016
Sold by
Gill Kewal S and Gill Amandeep K
Bought by
Al Abid Mutaz A
Purchase Details
Closed on
Feb 8, 2016
Sold by
Singh Karmbir and Singh Gurwant
Bought by
Gill Kewal S and Gill Sukhwant S
Purchase Details
Closed on
Mar 2, 2004
Sold by
Wells Fargo Bank Minnesota Na
Bought by
Singh Karmbir
Purchase Details
Closed on
Sep 5, 2002
Sold by
Wolfe Charles D
Bought by
Option One Mtg Loan Trust 1999 A
Purchase Details
Closed on
Oct 30, 1996
Sold by
Kow John A and Kow Constance
Bought by
Wolfe Charles D
Purchase Details
Closed on
Jun 12, 1996
Sold by
Wolfe Charles D
Bought by
Kowalczyk John A and Kowalczyk Constance
Create a Home Valuation Report for This Property
The Home Valuation Report is an in-depth analysis detailing your home's value as well as a comparison with similar homes in the area
Home Values in the Area
Average Home Value in this Area
Purchase History
| Date | Buyer | Sale Price | Title Company |
|---|---|---|---|
| Al-Abed Bayada Quad-Harabed | -- | None Listed On Document | |
| Al-Abed Bayada Quad-Harabed | -- | None Listed On Document | |
| Al Abid Mutaz A | -- | None Available | |
| Al Abid Mutaz A | -- | Ft | |
| Gill Kewal S | -- | Attorney | |
| Singh Karmbir | $36,000 | Metropolitan | |
| Option One Mtg Loan Trust 1999 A | $51,100 | -- | |
| Wolfe Charles D | $27,300 | -- | |
| Kowalczyk John A | $27,300 | -- |
Source: Public Records
Tax History Compared to Growth
Tax History
| Year | Tax Paid | Tax Assessment Tax Assessment Total Assessment is a certain percentage of the fair market value that is determined by local assessors to be the total taxable value of land and additions on the property. | Land | Improvement |
|---|---|---|---|---|
| 2025 | $966 | $54,200 | $0 | $0 |
| 2024 | $966 | $45,500 | $0 | $0 |
| 2023 | $867 | $39,200 | $0 | $0 |
| 2022 | $24,378 | $32,900 | $0 | $0 |
| 2021 | $1,594 | $28,900 | $0 | $0 |
| 2019 | $1,445 | $21,800 | $0 | $0 |
| 2018 | $1,129 | $22,100 | $0 | $0 |
| 2017 | $592 | $21,500 | $0 | $0 |
| 2016 | $1,167 | $21,800 | $0 | $0 |
| 2015 | $2,030 | $20,300 | $0 | $0 |
| 2013 | $2,200 | $23,000 | $0 | $0 |
| 2010 | -- | $24,800 | $0 | $0 |
Source: Public Records
Map
Nearby Homes
- 25452 Notre Dame St
- 25716 Notre Dame St
- 3350 Heritage Pkwy
- 25933 Norfolk St
- 25960 Yale St
- 3317 Heritage Pkwy
- 26115 Princeton St
- 441 Francesco Ct
- 3501 Westwood St
- 24816 Chicago St
- 26160 Princeton St
- 24917 Penn St
- 0000 Ross Ross St
- 26206 Kitch St
- 26269 Dunning St
- 24910 Hickory St
- 24517 Calvin St
- 24437 Boston St
- 25866 Andover St
- 24716 Ross St
- 25520 New York St
- 25516 New York St
- 25526 New York St
- 25456 New York St
- 25538 New York St
- 25521 Yale St
- 25517 Yale St
- 25527 Yale St
- 25450 New York St
- 25535 Yale St
- 25507 Yale St
- 25521 New York St
- 25521 New York St
- 25515 New York St
- 25509 New York St
- 25543 Yale St
- 25475 Yale St
- 25436 New York St
- 25503 New York St Unit Bldg-Unit
- 25503 New York St