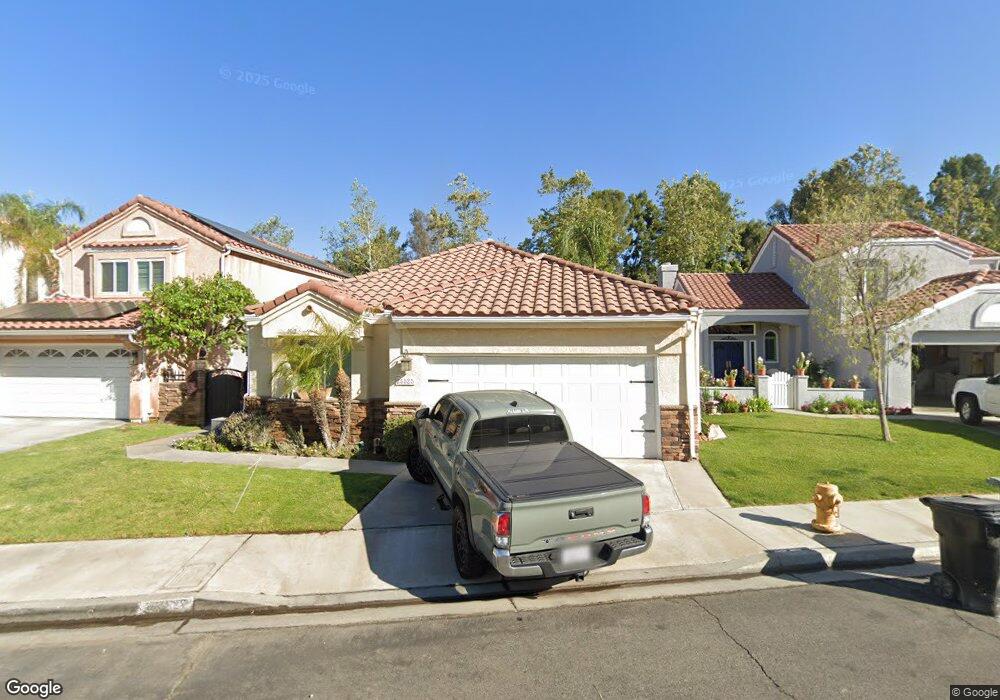
25525 Palermo Way Yorba Linda, CA 92887
Estimated Value: $927,000 - $1,135,000
3
Beds
2
Baths
1,724
Sq Ft
$620/Sq Ft
Est. Value
About This Home
This home is located at 25525 Palermo Way, Yorba Linda, CA 92887 and is currently estimated at $1,069,363, approximately $620 per square foot. 25525 Palermo Way is a home located in Orange County with nearby schools including Bryant Ranch Elementary School, Travis Ranch Middle School, and Yorba Linda High School.
Ownership History
Date
Name
Owned For
Owner Type
Purchase Details
Closed on
Nov 14, 2022
Sold by
Hill Steven P and Hill Theresa L
Bought by
Steven And Theresa Hill Family Trust
Current Estimated Value
Purchase Details
Closed on
Jan 17, 2002
Sold by
Hill Steven P and Hill Theresa L
Bought by
Hill Steven P and Hill Theresa L
Home Financials for this Owner
Home Financials are based on the most recent Mortgage that was taken out on this home.
Original Mortgage
$270,000
Interest Rate
7.17%
Purchase Details
Closed on
Nov 4, 1999
Sold by
Mark Selover and Mark Richard Richard
Bought by
Hill Steven P and Winder Theresa L
Home Financials for this Owner
Home Financials are based on the most recent Mortgage that was taken out on this home.
Original Mortgage
$202,400
Interest Rate
8.5%
Purchase Details
Closed on
Jun 30, 1994
Sold by
Selover Cecelia
Bought by
Selover Mark
Create a Home Valuation Report for This Property
The Home Valuation Report is an in-depth analysis detailing your home's value as well as a comparison with similar homes in the area
Home Values in the Area
Average Home Value in this Area
Purchase History
| Date | Buyer | Sale Price | Title Company |
|---|---|---|---|
| Steven And Theresa Hill Family Trust | -- | -- | |
| Hill Steven P | -- | -- | |
| Hill Steven P | $253,000 | Lawyers Title Company | |
| Selover Mark | -- | Lawyers Title Company | |
| Selover Mark | -- | -- |
Source: Public Records
Mortgage History
| Date | Status | Borrower | Loan Amount |
|---|---|---|---|
| Previous Owner | Hill Steven P | $270,000 | |
| Previous Owner | Hill Steven P | $202,400 | |
| Closed | Hill Steven P | $50,600 |
Source: Public Records
Tax History Compared to Growth
Tax History
| Year | Tax Paid | Tax Assessment Tax Assessment Total Assessment is a certain percentage of the fair market value that is determined by local assessors to be the total taxable value of land and additions on the property. | Land | Improvement |
|---|---|---|---|---|
| 2025 | $5,935 | $508,457 | $232,843 | $275,614 |
| 2024 | $5,935 | $498,488 | $228,278 | $270,210 |
| 2023 | $5,778 | $488,714 | $223,802 | $264,912 |
| 2022 | $5,694 | $479,132 | $219,414 | $259,718 |
| 2021 | $5,588 | $469,738 | $215,112 | $254,626 |
| 2020 | $5,525 | $464,922 | $212,906 | $252,016 |
| 2019 | $5,367 | $455,806 | $208,731 | $247,075 |
| 2018 | $5,355 | $446,869 | $204,638 | $242,231 |
| 2017 | $5,512 | $438,107 | $200,625 | $237,482 |
| 2016 | $5,127 | $429,517 | $196,691 | $232,826 |
| 2015 | $5,238 | $423,066 | $193,737 | $229,329 |
| 2014 | $5,125 | $414,779 | $189,942 | $224,837 |
Source: Public Records
Map
Nearby Homes
- 25511 Palermo Way
- 5917 San Remo Way
- 25540 Aragon Way
- 0 Meadow Land Dr
- 25633 Corsica Way
- 23964 Old Pomegranate Rd
- 27870 Tamara Dr
- 5527 Patricia Way
- 23985 Nicole Way Unit 31
- 24670 Paseo de Toronto
- 5570 Meadow Lake Ln
- 5420 Los Monteros
- 5425 Castle Bend Way
- 23556 Cambridge Rd Unit 327
- 27025 Glaramara Ln
- 23502 Cambridge Rd Unit 306
- 27170 Big Horn Mountain Way
- 28685 Morning Dew Way
- 23482 Cambridge Rd Unit 294
- 6208 Hartford Rd Unit 198
- 25523 Palermo Way
- 25527 Palermo Way
- 25521 Palermo Way
- 25529 Palermo Way
- 25519 Palermo Way
- 25531 Palermo Way
- 25516 Palermo Way
- 25514 Palermo Way
- 25518 Palermo Way
- 25512 Palermo Way
- 25517 Palermo Way
- 25533 Palermo Way
- 25520 Palermo Way
- 25510 Palermo Way
- 25508 Palermo Way
- 25535 Palermo Way
- 25515 Palermo Way
- 25522 Palermo Way
- 25557 Salerno Way
- 25561 Salerno Way