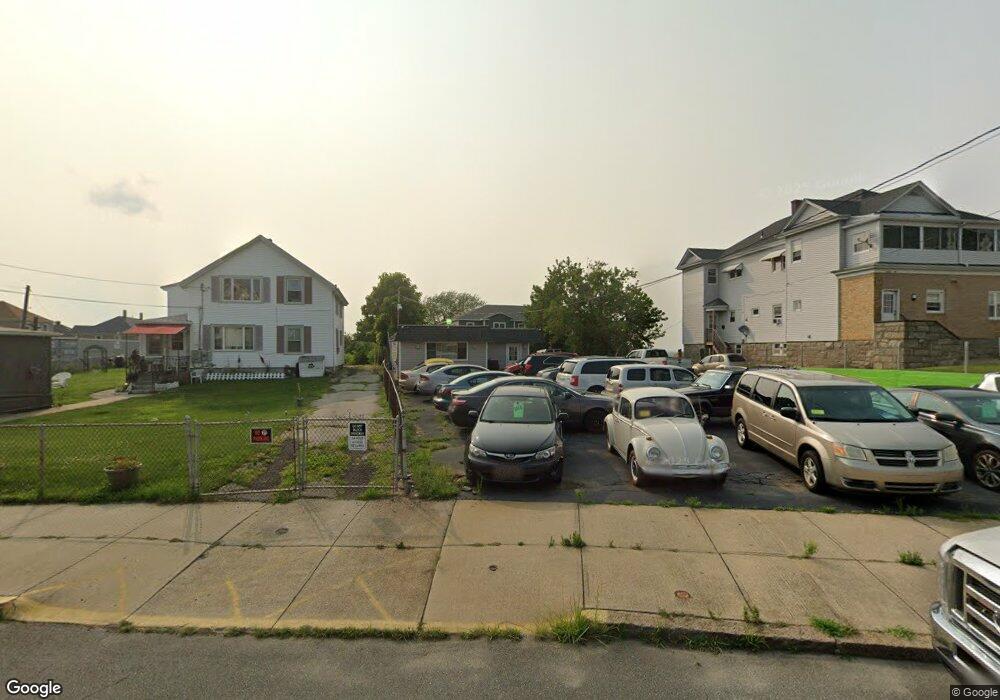
2553 S Main St Fall River, MA 02724
Sandy Beach NeighborhoodEstimated Value: $306,434
Studio
--
Bath
864
Sq Ft
$355/Sq Ft
Est. Value
About This Home
This home is located at 2553 S Main St, Fall River, MA 02724 and is currently estimated at $306,434, approximately $354 per square foot. 2553 S Main St is a home located in Bristol County with nearby schools including Henry Lord Community School, B M C Durfee High School, and Argosy Collegiate Charter School.
Ownership History
Date
Name
Owned For
Owner Type
Purchase Details
Closed on
Oct 19, 1998
Sold by
Bouchard Armand J and Bouchard Vivian
Bought by
Thornsbury Steven S and Thornsbury Cynthia M
Current Estimated Value
Home Financials for this Owner
Home Financials are based on the most recent Mortgage that was taken out on this home.
Original Mortgage
$108,000
Outstanding Balance
$23,442
Interest Rate
6.8%
Mortgage Type
Commercial
Estimated Equity
$282,992
Create a Home Valuation Report for This Property
The Home Valuation Report is an in-depth analysis detailing your home's value as well as a comparison with similar homes in the area
Home Values in the Area
Average Home Value in this Area
Purchase History
| Date | Buyer | Sale Price | Title Company |
|---|---|---|---|
| Thornsbury Steven S | $120,000 | -- |
Source: Public Records
Mortgage History
| Date | Status | Borrower | Loan Amount |
|---|---|---|---|
| Open | Thornsbury Steven S | $108,000 |
Source: Public Records
Tax History
| Year | Tax Paid | Tax Assessment Tax Assessment Total Assessment is a certain percentage of the fair market value that is determined by local assessors to be the total taxable value of land and additions on the property. | Land | Improvement |
|---|---|---|---|---|
| 2025 | $4,997 | $209,700 | $135,700 | $74,000 |
| 2024 | $4,850 | $202,600 | $129,200 | $73,400 |
| 2023 | $4,745 | $184,200 | $117,400 | $66,800 |
| 2022 | $4,979 | $184,200 | $117,400 | $66,800 |
| 2021 | $4,915 | $165,500 | $115,700 | $49,800 |
| 2020 | $4,640 | $151,600 | $121,000 | $30,600 |
| 2019 | $4,754 | $151,600 | $121,000 | $30,600 |
| 2018 | $4,021 | $129,200 | $97,000 | $32,200 |
| 2017 | $3,959 | $129,200 | $97,000 | $32,200 |
| 2016 | $3,764 | $129,200 | $97,000 | $32,200 |
| 2015 | $3,636 | $129,200 | $97,000 | $32,200 |
| 2014 | $3,447 | $129,200 | $97,000 | $32,200 |
Source: Public Records
Map
Nearby Homes
- 2547 S Main St Unit 1N
- 2547 S Main St
- 579 Summit St Unit 1
- 2541 S Main St
- 2589 S Main St
- 2589 S Main St Unit 2
- 561 Summit St
- 2599 S Main St
- 541 Summit St
- 2527 S Main St
- 192 Last St
- 2542 S Main St
- 152 Last St
- 9 Townsend St
- 2528 S Main St
- 519 Summit St
- 23 Townsend St
- 366 Bayview St
- 148 Last St Unit 3N
- 134 Last St Unit 2R
Your Personal Tour Guide
Ask me questions while you tour the home.