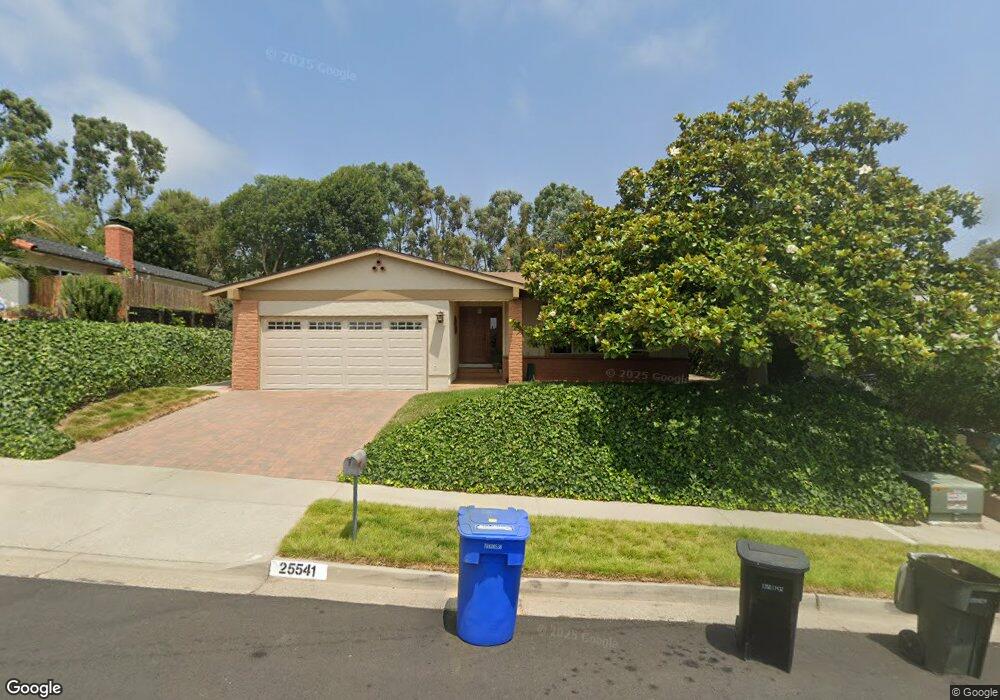
25541 Via Inez Rd San Juan Capistrano, CA 92675
Estimated Value: $1,250,955 - $1,523,000
3
Beds
2
Baths
1,541
Sq Ft
$891/Sq Ft
Est. Value
About This Home
This home is located at 25541 Via Inez Rd, San Juan Capistrano, CA 92675 and is currently estimated at $1,372,489, approximately $890 per square foot. 25541 Via Inez Rd is a home located in Orange County with nearby schools including Del Obispo Elementary School, Marco Forster Middle School, and San Juan Hills High School.
Ownership History
Date
Name
Owned For
Owner Type
Purchase Details
Closed on
Feb 25, 2014
Sold by
Barker Steven Andrew and Nguyen Tam Thi
Bought by
25541 Via Inez Living Trust
Current Estimated Value
Home Financials for this Owner
Home Financials are based on the most recent Mortgage that was taken out on this home.
Original Mortgage
$102,000
Outstanding Balance
$30,090
Interest Rate
4.38%
Mortgage Type
New Conventional
Estimated Equity
$1,342,399
Purchase Details
Closed on
Mar 11, 2003
Sold by
Barker Steven Andrew and Nguyen Tam Thi
Bought by
Barker Steven Andrew and Nguyen Tam Thi
Purchase Details
Closed on
Dec 10, 1996
Sold by
Messina Hilda L
Bought by
Baker Steven Andrew and Nguyen Tam Thi
Home Financials for this Owner
Home Financials are based on the most recent Mortgage that was taken out on this home.
Original Mortgage
$147,200
Interest Rate
7.58%
Create a Home Valuation Report for This Property
The Home Valuation Report is an in-depth analysis detailing your home's value as well as a comparison with similar homes in the area
Home Values in the Area
Average Home Value in this Area
Purchase History
| Date | Buyer | Sale Price | Title Company |
|---|---|---|---|
| 25541 Via Inez Living Trust | -- | First American Title Company | |
| Barker Steven Andrew | -- | First American Title Company | |
| Barker Steven Andrew | -- | American Title Co | |
| Baker Steven Andrew | $184,000 | Chicago Title Co |
Source: Public Records
Mortgage History
| Date | Status | Borrower | Loan Amount |
|---|---|---|---|
| Open | Barker Steven Andrew | $102,000 | |
| Closed | Baker Steven Andrew | $147,200 |
Source: Public Records
Tax History Compared to Growth
Tax History
| Year | Tax Paid | Tax Assessment Tax Assessment Total Assessment is a certain percentage of the fair market value that is determined by local assessors to be the total taxable value of land and additions on the property. | Land | Improvement |
|---|---|---|---|---|
| 2025 | $4,254 | $299,665 | $196,807 | $102,858 |
| 2024 | $4,254 | $293,790 | $192,948 | $100,842 |
| 2023 | $4,097 | $288,030 | $189,165 | $98,865 |
| 2022 | $3,755 | $282,383 | $185,456 | $96,927 |
| 2021 | $3,646 | $276,847 | $181,820 | $95,027 |
| 2020 | $3,644 | $274,009 | $179,956 | $94,053 |
| 2019 | $3,400 | $268,637 | $176,428 | $92,209 |
| 2018 | $3,368 | $263,370 | $172,969 | $90,401 |
| 2017 | $3,244 | $258,206 | $169,577 | $88,629 |
| 2016 | $3,287 | $253,144 | $166,252 | $86,892 |
| 2015 | $3,293 | $249,342 | $163,755 | $85,587 |
| 2014 | $3,219 | $244,458 | $160,547 | $83,911 |
Source: Public Records
Map
Nearby Homes
- 32481 Spyglass Ct
- 25571 Via Inez Rd
- 32602 Deadwood Dr
- 32672 Alta Pine Ln
- 32791 Del Obispo St
- 5 Old Ranch Rd
- 32862 Bluffside Dr
- 32881 Calle Miguel
- 32972 Paseo Miraflores
- 2 Point Catalina
- 25852 Calle Ricardo
- 15 Glastonbury Place
- 33041 Lighthouse Ct
- 26092 Calle Cobblestone
- 1 Searidge
- 33095 Regatta Ct
- 31 La Paloma
- 31891 Paseo Alto Plano
- 6 Inspiration Point
- 32371 Alipaz St Unit 121
- 25531 Via Inez Rd
- 25551 Via Inez Rd
- 32482 Lookout Ct
- 25521 Via Inez Rd
- 25561 Via Inez Rd
- 32491 Spyglass Ct
- 32472 Lookout Ct
- 25542 Via Inez Rd
- 32462 Lookout Ct
- 25532 Via Inez Rd
- 25552 Via Inez Rd
- 32471 Spyglass Ct
- 32472 Fathom Ct
- 25522 Via Inez Rd
- 32462 Fathom Ct
- 25562 Via Inez Rd
- 32452 Fathom Ct
- 32492 Spyglass Ct
- 32482 Spyglass Ct
- 25512 Via Inez Rd