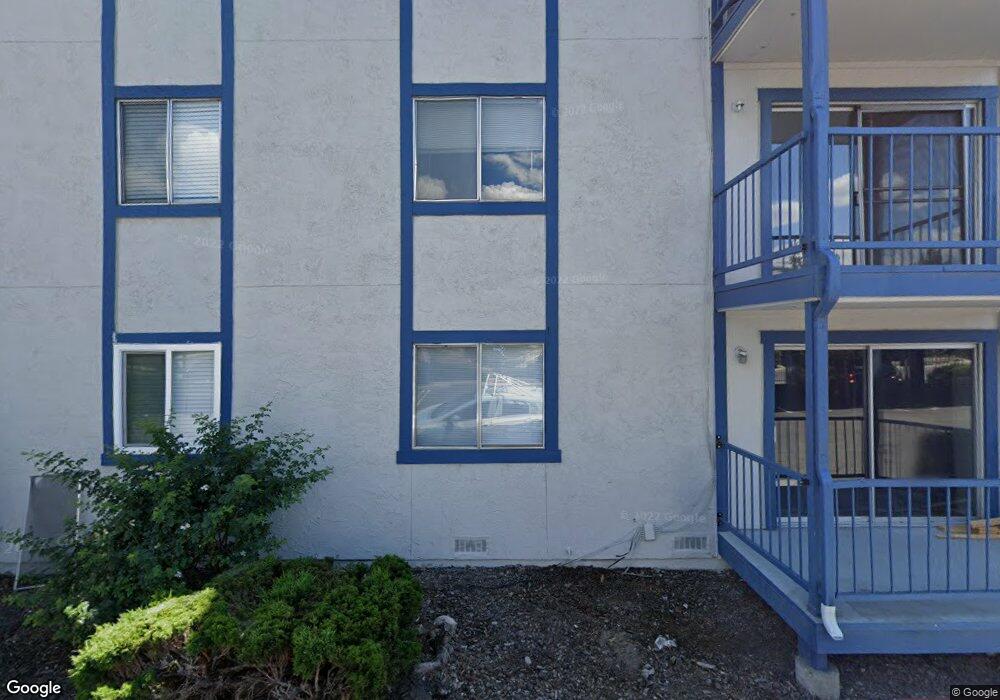
2555 Clear Acre Ln Unit 94-1 Reno, NV 89512
Northeast Reno NeighborhoodEstimated Value: $123,000 - $149,000
1
Bed
1
Bath
668
Sq Ft
$209/Sq Ft
Est. Value
About This Home
This home is located at 2555 Clear Acre Ln Unit 94-1, Reno, NV 89512 and is currently estimated at $139,537, approximately $208 per square foot. 2555 Clear Acre Ln Unit 94-1 is a home located in Washoe County with nearby schools including Rita Cannan Elementary School, Fred W. Traner Middle School, and Procter R. Hug High School.
Ownership History
Date
Name
Owned For
Owner Type
Purchase Details
Closed on
Apr 23, 2020
Sold by
Poker Brown Llc
Bought by
Elkridge Investments Llc
Current Estimated Value
Purchase Details
Closed on
Oct 3, 2018
Sold by
Cheng Siu Ming
Bought by
Porker Brown Llc
Purchase Details
Closed on
Jul 20, 2018
Sold by
Cheng Shiao L and Cheng Shiao
Bought by
Cheng Siu Ming
Purchase Details
Closed on
Jan 23, 2004
Sold by
Johns Ling and Johns Gerald J
Bought by
Cheng Shiao
Purchase Details
Closed on
Oct 4, 2001
Sold by
Chen Chiqi
Bought by
Gou Ling
Purchase Details
Closed on
Apr 2, 2001
Sold by
Dow Stephen D and Dow Martha B
Bought by
Chen Chiqi and Gou Ling
Purchase Details
Closed on
Mar 7, 1995
Sold by
Dow Stephen D and Dow Martha B
Bought by
Dow Stephen D and Dow Martha B
Create a Home Valuation Report for This Property
The Home Valuation Report is an in-depth analysis detailing your home's value as well as a comparison with similar homes in the area
Home Values in the Area
Average Home Value in this Area
Purchase History
| Date | Buyer | Sale Price | Title Company |
|---|---|---|---|
| Elkridge Investments Llc | $102,500 | Tolyabe Title | |
| Porker Brown Llc | $68,500 | Reliant Title Reno | |
| Cheng Siu Ming | -- | None Available | |
| Cheng Shiao | $40,000 | Stewart Title Of Northern Nv | |
| Gou Ling | -- | -- | |
| Chen Chiqi | $30,000 | Western Title Inc | |
| Dow Stephen D | -- | -- |
Source: Public Records
Tax History Compared to Growth
Tax History
| Year | Tax Paid | Tax Assessment Tax Assessment Total Assessment is a certain percentage of the fair market value that is determined by local assessors to be the total taxable value of land and additions on the property. | Land | Improvement |
|---|---|---|---|---|
| 2026 | -- | $24,239 | $11,235 | $13,004 |
| 2025 | $150 | $24,615 | $11,235 | $13,380 |
| 2024 | $150 | $25,534 | $11,445 | $14,089 |
| 2023 | $146 | $23,644 | $10,885 | $12,759 |
| 2022 | $142 | $19,913 | $8,645 | $11,268 |
| 2021 | $142 | $17,682 | $6,230 | $11,452 |
| 2020 | $133 | $17,920 | $6,160 | $11,760 |
| 2019 | $127 | $15,892 | $4,235 | $11,657 |
| 2018 | $121 | $14,590 | $3,045 | $11,545 |
| 2017 | $118 | $13,773 | $2,135 | $11,638 |
| 2016 | $115 | $8,169 | $2,100 | $6,069 |
| 2015 | $115 | $8,260 | $1,400 | $6,860 |
| 2014 | $141 | $7,665 | $1,015 | $6,650 |
| 2013 | -- | $2,949 | $525 | $2,424 |
Source: Public Records
Map
Nearby Homes
- 2555 Clear Acre Ln Unit 29-2
- 2555 Clear Acre Ln Unit 16-1
- 2555 Clear Acre Ln Unit 32
- 2555 Clear Acre Ln Unit 9-3
- 2555 Clear Acre Ln Unit 93-3
- 2520 Tripp Dr Unit A1L
- 2101 Highview Ct Unit 9
- 2065 Wedekind Rd
- 2355 Tripp Dr Unit 7
- 1405 Selmi Dr Unit 44
- 2740 Scottsdale Rd
- 2085 Highview Ct Unit 2
- 2085 Highview Ct Unit 1
- 3140 Orrizonte Terrace
- 3325 Clear Acre Ln
- 2650 Daffodil Way
- 2735 Daffodil Way
- 1955 Wilder St
- 2090 Fife Dr
- 3156 Orrizonte Terrace
- 2555 Clear Acre Ln Unit 73-86-2
- 2555 Clear Acre Ln Unit 83
- 2555 Clear Acre Ln Unit 84-3
- 2555 Clear Acre Ln Unit 76-1
- 2555 Clear Acre Ln Unit 8-2
- 2555 Clear Acre Ln Unit 25-1
- 2555 Clear Acre Ln Unit 4
- 2555 Clear Acre Ln Unit 115-1
- 2555 Clear Acre Ln Unit 21
- 2555 Clear Acre Ln Unit 17-2
- 2555 Clear Acre Ln Unit 4-1
- 2555 Clear Acre Ln Unit 21-3
- 2555 Clear Acre Ln Unit 96-3
- 2555 Clear Acre Ln Unit 83-2
- 2555 Clear Acre Ln Unit 27
- 2555 Clear Acre Ln Unit 21-3 3RDFL
- 2555 Clear Acre Ln Unit 26-2
- 2555 Clear Acre Ln Unit 125
- 2555 Clear Acre Ln Unit 116-2
- 2555 Clear Acre Ln Unit 75