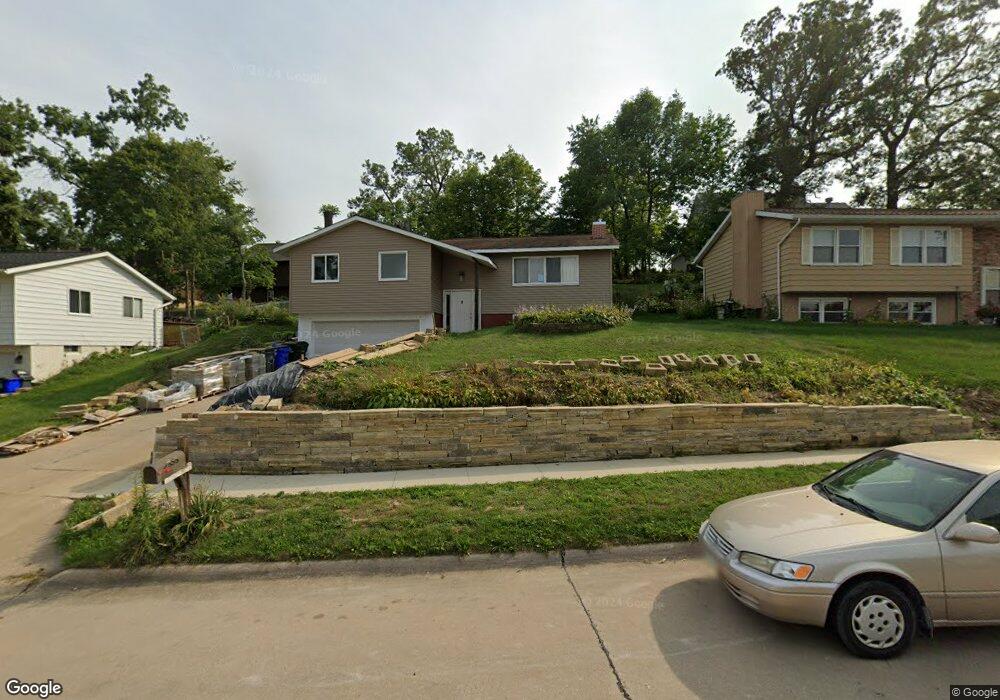
2555 M Ave NW Cedar Rapids, IA 52405
Estimated Value: $216,000 - $238,000
3
Beds
3
Baths
1,176
Sq Ft
$192/Sq Ft
Est. Value
About This Home
This home is located at 2555 M Ave NW, Cedar Rapids, IA 52405 and is currently estimated at $226,058, approximately $192 per square foot. 2555 M Ave NW is a home located in Linn County with nearby schools including Kentucky Tech - Ashland Reg Tech Center, Ponderosa Elementary School, and Madison Elementary School.
Ownership History
Date
Name
Owned For
Owner Type
Purchase Details
Closed on
May 18, 2011
Sold by
Tran Theodore V and Tran Therese
Bought by
Tran Trong and Luong Trong
Current Estimated Value
Home Financials for this Owner
Home Financials are based on the most recent Mortgage that was taken out on this home.
Original Mortgage
$29,000
Outstanding Balance
$20,089
Interest Rate
4.81%
Mortgage Type
Seller Take Back
Estimated Equity
$205,969
Purchase Details
Closed on
Jun 15, 2001
Sold by
Leitch Joel L
Bought by
Tran Theodore V
Home Financials for this Owner
Home Financials are based on the most recent Mortgage that was taken out on this home.
Original Mortgage
$94,500
Interest Rate
7.16%
Purchase Details
Closed on
Aug 13, 2000
Sold by
Hanson Lyle K and Hanson Anne
Bought by
Leitch Joel S
Home Financials for this Owner
Home Financials are based on the most recent Mortgage that was taken out on this home.
Original Mortgage
$77,250
Interest Rate
8.16%
Create a Home Valuation Report for This Property
The Home Valuation Report is an in-depth analysis detailing your home's value as well as a comparison with similar homes in the area
Home Values in the Area
Average Home Value in this Area
Purchase History
| Date | Buyer | Sale Price | Title Company |
|---|---|---|---|
| Tran Trong | $89,500 | None Available | |
| Tran Theodore V | $104,500 | -- | |
| Leitch Joel S | $102,500 | -- |
Source: Public Records
Mortgage History
| Date | Status | Borrower | Loan Amount |
|---|---|---|---|
| Open | Tran Trong | $29,000 | |
| Previous Owner | Tran Theodore V | $94,500 | |
| Previous Owner | Leitch Joel S | $77,250 |
Source: Public Records
Tax History Compared to Growth
Tax History
| Year | Tax Paid | Tax Assessment Tax Assessment Total Assessment is a certain percentage of the fair market value that is determined by local assessors to be the total taxable value of land and additions on the property. | Land | Improvement |
|---|---|---|---|---|
| 2025 | $3,146 | $212,600 | $40,500 | $172,100 |
| 2024 | $3,380 | $196,700 | $40,500 | $156,200 |
| 2023 | $3,380 | $188,200 | $35,400 | $152,800 |
| 2022 | $2,954 | $169,100 | $35,400 | $133,700 |
| 2021 | $3,058 | $151,600 | $32,100 | $119,500 |
| 2020 | $3,058 | $147,200 | $32,100 | $115,100 |
| 2019 | $2,668 | $132,300 | $27,000 | $105,300 |
| 2018 | $2,590 | $132,300 | $27,000 | $105,300 |
| 2017 | $2,831 | $133,200 | $27,000 | $106,200 |
| 2016 | $2,831 | $133,200 | $27,000 | $106,200 |
| 2015 | $2,843 | $133,607 | $26,995 | $106,612 |
| 2014 | $2,658 | $133,607 | $26,995 | $106,612 |
| 2013 | $2,596 | $133,607 | $26,995 | $106,612 |
Source: Public Records
Map
Nearby Homes
- 2520 N Ave NW
- 2801 Schultz Dr NW
- 2825 Schultz Dr NW
- 2210 O Ave NW
- 1322 Woodside Dr NW
- 2623 Iris Ave NW
- 949 Westwood Dr NW
- 1613 Southview Dr NW
- 0 O Ave NW
- 1733 Hillside Dr NW
- 912 29th St NW
- 3313 Crestwood Dr NW
- 327* Edgewood Rd NW
- 623 27th St NW
- 1724 O Ave NW
- 615 27th St NW
- 1814 Shawnee Ct NW
- 3312 G Ave NW
- 451 23rd St NW
- 425 28th St NW