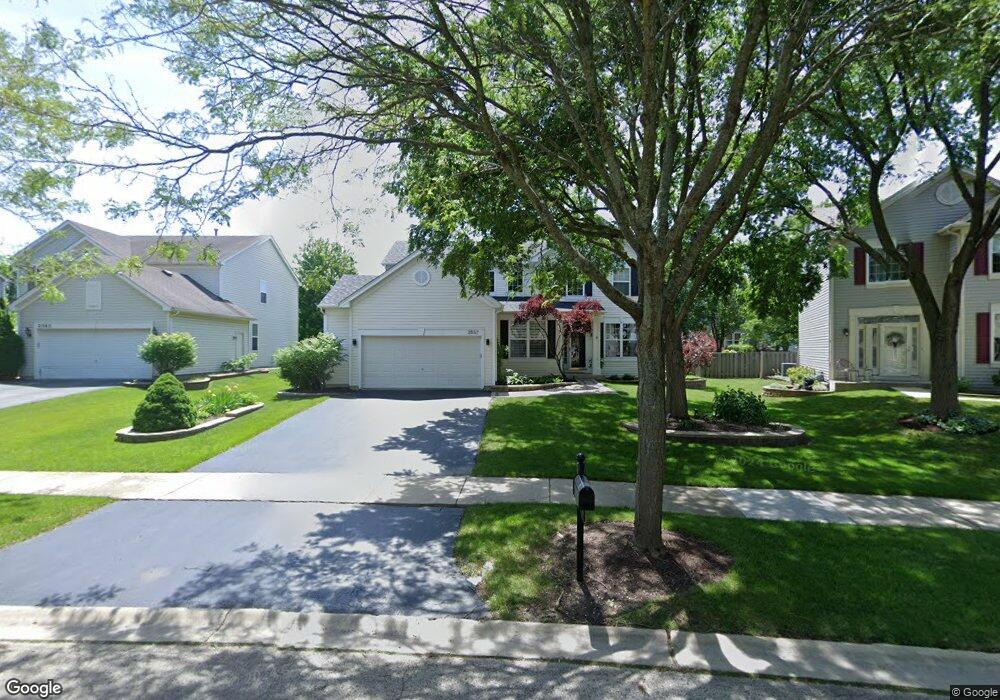
2557 Red Hawk Ridge Dr Unit 1 Aurora, IL 60503
Far Southeast NeighborhoodEstimated Value: $439,613 - $466,000
--
Bed
1
Bath
2,329
Sq Ft
$195/Sq Ft
Est. Value
About This Home
This home is located at 2557 Red Hawk Ridge Dr Unit 1, Aurora, IL 60503 and is currently estimated at $454,153, approximately $194 per square foot. 2557 Red Hawk Ridge Dr Unit 1 is a home located in Will County with nearby schools including Wolfs Crossing Elementary School, Bednarcik Jr. High School, and Oswego East High School.
Ownership History
Date
Name
Owned For
Owner Type
Purchase Details
Closed on
Sep 18, 2024
Sold by
Freveletti Daniel J and Freveletti Andrea L
Bought by
Daniel J Freveletti Trust and Andrea L Freveletti Trust
Current Estimated Value
Purchase Details
Closed on
Sep 12, 2001
Sold by
The Ryland Group Inc
Bought by
Freveletti Daniel J and Freveletti Andrea L
Home Financials for this Owner
Home Financials are based on the most recent Mortgage that was taken out on this home.
Original Mortgage
$218,180
Interest Rate
7.16%
Mortgage Type
FHA
Create a Home Valuation Report for This Property
The Home Valuation Report is an in-depth analysis detailing your home's value as well as a comparison with similar homes in the area
Home Values in the Area
Average Home Value in this Area
Purchase History
| Date | Buyer | Sale Price | Title Company |
|---|---|---|---|
| Daniel J Freveletti Trust | -- | None Listed On Document | |
| Freveletti Daniel J | $221,500 | Ticor Title |
Source: Public Records
Mortgage History
| Date | Status | Borrower | Loan Amount |
|---|---|---|---|
| Previous Owner | Freveletti Daniel J | $218,180 |
Source: Public Records
Tax History Compared to Growth
Tax History
| Year | Tax Paid | Tax Assessment Tax Assessment Total Assessment is a certain percentage of the fair market value that is determined by local assessors to be the total taxable value of land and additions on the property. | Land | Improvement |
|---|---|---|---|---|
| 2024 | $10,201 | $125,037 | $23,259 | $101,778 |
| 2023 | $10,201 | $110,457 | $20,547 | $89,910 |
| 2022 | $9,767 | $99,147 | $19,437 | $79,710 |
| 2021 | $9,211 | $94,425 | $18,511 | $75,914 |
| 2020 | $8,817 | $92,929 | $18,218 | $74,711 |
| 2019 | $8,909 | $90,310 | $17,705 | $72,605 |
| 2018 | $8,755 | $86,020 | $17,315 | $68,705 |
| 2017 | $8,608 | $83,799 | $16,868 | $66,931 |
| 2016 | $8,628 | $81,995 | $16,505 | $65,490 |
| 2015 | $8,928 | $78,841 | $15,870 | $62,971 |
| 2014 | $8,928 | $78,320 | $15,870 | $62,450 |
| 2013 | $8,928 | $78,320 | $15,870 | $62,450 |
Source: Public Records
Map
Nearby Homes
- 2566 Rourke Dr
- 2532 Sagamore Cir
- 2326 Sunshine Ln Unit 1969
- 2197 Wilson Creek Cir Unit 3
- 2357 Twilight Dr
- 2413 Dickens Dr
- 2310 Twilight Dr
- 2295 Twilight Dr
- 2495 Hafenrichter Rd
- 1961 Wilson Creek Cir
- 2232 Daybreak Dr
- 2234 Daybreak Dr
- 3302 Wildlight Rd
- 3328 Fulshear Cir
- 3237 Peyton Cir
- 1769 Baler Ave
- 3235 Kimblewick Cir
- 1906 Indian Hill Ln Unit 4223
- 2735 Hillsboro Blvd Unit 3
- 2723 Hillsboro Blvd
- 2549 Red Hawk Ridge Dr
- 2565 Red Hawk Ridge Dr
- 2338 Shadow Hills Ln Unit 1
- 2332 Shadow Hills Ln Unit 1
- 2541 Red Hawk Ridge Dr Unit 1
- 2573 Red Hawk Ridge Dr
- 2344 Shadow Hills Ln
- 2326 Shadow Hills Ln
- 2560 Red Hawk Ridge Dr Unit 1
- 2350 Shadow Hills Ln
- 2540 Red Hawk Ridge Dr
- 2533 Red Hawk Ridge Dr Unit 1
- 2581 Red Hawk Ridge Dr Unit 1
- 2568 Red Hawk Ridge Dr Unit 1
- 2320 Shadow Hills Ln Unit 1
- 2356 Shadow Hills Ln
- 2576 Red Hawk Ridge Dr
- 2589 Red Hawk Ridge Dr
- 2525 Red Hawk Ridge Dr
- 2341 Shiloh Dr Unit 1