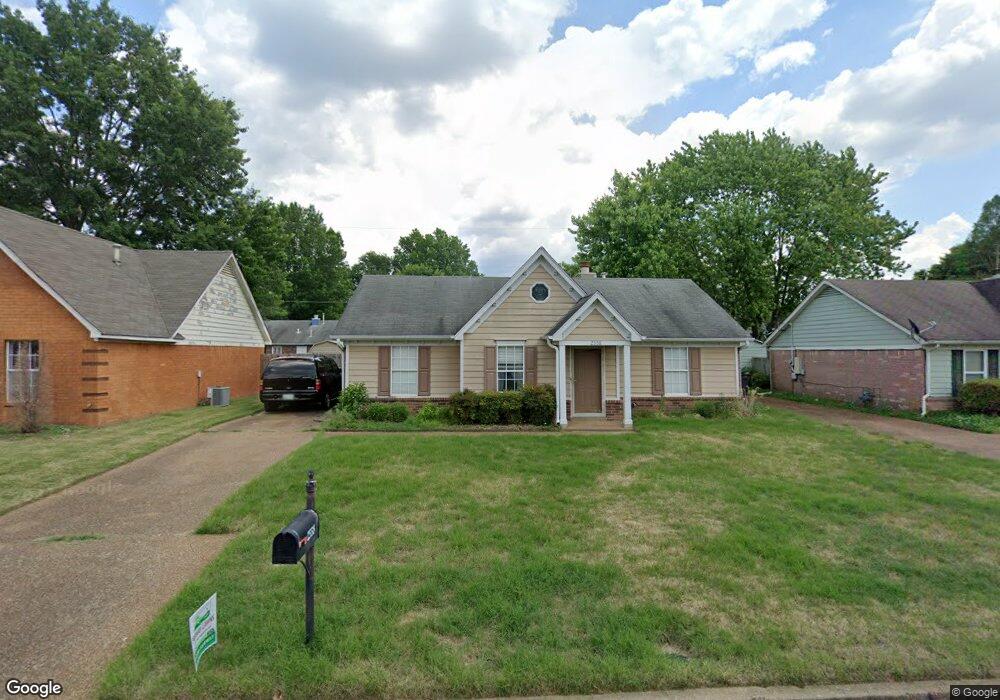
2558 Arborgreen Cove Memphis, TN 38133
Estimated Value: $202,000 - $226,000
3
Beds
2
Baths
1,152
Sq Ft
$184/Sq Ft
Est. Value
About This Home
This home is located at 2558 Arborgreen Cove, Memphis, TN 38133 and is currently estimated at $211,729, approximately $183 per square foot. 2558 Arborgreen Cove is a home located in Shelby County with nearby schools including Kate Bond Elementary School, Kate Bond Middle School, and Cordova High School.
Ownership History
Date
Name
Owned For
Owner Type
Purchase Details
Closed on
Jun 30, 2011
Sold by
Gicking David G
Bought by
Heyser Shavon L
Current Estimated Value
Home Financials for this Owner
Home Financials are based on the most recent Mortgage that was taken out on this home.
Original Mortgage
$84,794
Outstanding Balance
$58,992
Interest Rate
4.75%
Mortgage Type
FHA
Estimated Equity
$152,737
Purchase Details
Closed on
May 4, 2007
Sold by
Behrens Olivia K
Bought by
Gicking David G
Home Financials for this Owner
Home Financials are based on the most recent Mortgage that was taken out on this home.
Original Mortgage
$50,000
Interest Rate
6.1%
Mortgage Type
Purchase Money Mortgage
Purchase Details
Closed on
Mar 24, 2006
Sold by
Welch Patricia
Bought by
Behrens Olivia K
Home Financials for this Owner
Home Financials are based on the most recent Mortgage that was taken out on this home.
Original Mortgage
$74,880
Interest Rate
6.23%
Mortgage Type
Fannie Mae Freddie Mac
Create a Home Valuation Report for This Property
The Home Valuation Report is an in-depth analysis detailing your home's value as well as a comparison with similar homes in the area
Home Values in the Area
Average Home Value in this Area
Purchase History
| Date | Buyer | Sale Price | Title Company |
|---|---|---|---|
| Heyser Shavon L | $87,000 | Realty Title | |
| Gicking David G | $97,000 | None Available | |
| Behrens Olivia K | $96,000 | Home Surety Title & Escrow |
Source: Public Records
Mortgage History
| Date | Status | Borrower | Loan Amount |
|---|---|---|---|
| Open | Heyser Shavon L | $84,794 | |
| Previous Owner | Gicking David G | $50,000 | |
| Previous Owner | Behrens Olivia K | $74,880 |
Source: Public Records
Tax History Compared to Growth
Tax History
| Year | Tax Paid | Tax Assessment Tax Assessment Total Assessment is a certain percentage of the fair market value that is determined by local assessors to be the total taxable value of land and additions on the property. | Land | Improvement |
|---|---|---|---|---|
| 2025 | $1,012 | $52,050 | $8,750 | $43,300 |
| 2024 | $1,012 | $29,850 | $6,125 | $23,725 |
| 2023 | $1,818 | $29,850 | $6,125 | $23,725 |
| 2022 | $1,818 | $29,850 | $6,125 | $23,725 |
| 2021 | $1,030 | $29,850 | $6,125 | $23,725 |
| 2020 | $1,603 | $22,125 | $6,125 | $16,000 |
| 2019 | $707 | $22,125 | $6,125 | $16,000 |
| 2018 | $707 | $22,125 | $6,125 | $16,000 |
| 2017 | $724 | $22,125 | $6,125 | $16,000 |
| 2016 | $947 | $21,675 | $0 | $0 |
| 2014 | $947 | $21,675 | $0 | $0 |
Source: Public Records
Map
Nearby Homes
- 2554 Appling Glen Dr
- 2566 Austin Green Bay
- 7685 Crystal Brook Cove
- 7551 Meadowland Dr
- 7723 Reese Rd
- 2376 Pate Rd
- 2739 Lakeside Dr
- 2789 Arbor Lane Dr
- 7828 Deerfield Trace
- 2718 Kate Bond Rd
- 2412 Kate Bond Rd
- 2518 Bassfield Dr
- 2633 Sleepy Bend Cove
- 2511 Bassfield Dr
- 7183 Polder Dr
- 2498 Country Trail Dr
- 7118 Reese Rd
- 7270 Rose Trail Dr
- 7126 Dokkum Dr
- 2547 Reese Lake Cir
- 2552 Arborgreen Cove
- 2564 Arborgreen Cove
- 2557 Appling Crest Dr
- 2570 Arborgreen Cove
- 2563 Appling Crest Dr
- 2551 Appling Crest Dr
- 2546 Arborgreen Cove
- 2565 Arborgreen Cove
- 2569 Appling Crest Dr
- 2555 Arborgreen Cove
- 2576 Arborgreen Cove
- 2545 Appling Crest Dr
- 2571 Arborgreen Cove
- 2540 Arborgreen Cove
- 2575 Appling Crest Dr
- 2547 Arborgreen Cove
- 2577 Arborgreen Cove
- 2539 Appling Crest Dr
- 2582 Arborgreen Cove
- 2556 Appling Crest Dr