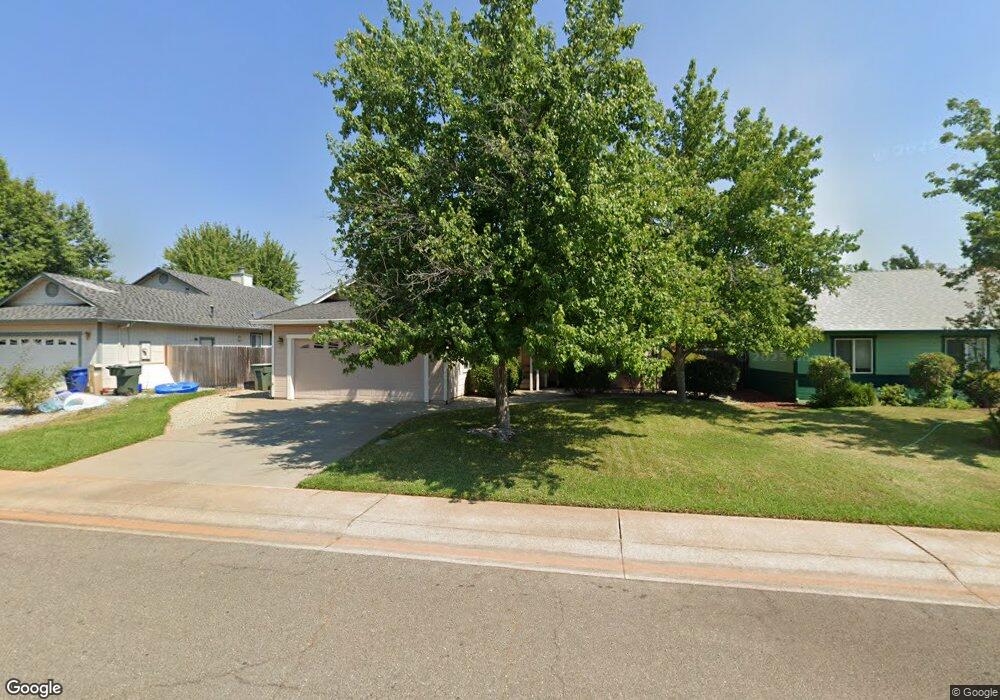
2558 Corona St Redding, CA 96002
Starview NeighborhoodEstimated Value: $320,000 - $365,000
3
Beds
2
Baths
1,345
Sq Ft
$255/Sq Ft
Est. Value
About This Home
This home is located at 2558 Corona St, Redding, CA 96002 and is currently estimated at $342,676, approximately $254 per square foot. 2558 Corona St is a home located in Shasta County with nearby schools including Alta Mesa Elementary School, Parsons Junior High School, and Enterprise High School.
Ownership History
Date
Name
Owned For
Owner Type
Purchase Details
Closed on
May 18, 2016
Sold by
Gordon Alexander L and Silver Anna Brelis
Bought by
Gordon Conrad C and Gordon Nancy E
Current Estimated Value
Purchase Details
Closed on
Feb 19, 2003
Sold by
Albion Joseph A and Albion Teresa L
Bought by
Gordon Alexander L
Home Financials for this Owner
Home Financials are based on the most recent Mortgage that was taken out on this home.
Original Mortgage
$131,900
Outstanding Balance
$56,407
Interest Rate
5.93%
Estimated Equity
$286,269
Purchase Details
Closed on
Mar 27, 1997
Sold by
Nickell Eric J and Nickell Ashley J
Bought by
Albion Joseph A and Albion Teresa L
Home Financials for this Owner
Home Financials are based on the most recent Mortgage that was taken out on this home.
Original Mortgage
$75,000
Interest Rate
7.63%
Create a Home Valuation Report for This Property
The Home Valuation Report is an in-depth analysis detailing your home's value as well as a comparison with similar homes in the area
Home Values in the Area
Average Home Value in this Area
Purchase History
| Date | Buyer | Sale Price | Title Company |
|---|---|---|---|
| Gordon Conrad C | -- | None Available | |
| Gordon Alexander L | $165,000 | Alliance Title Company | |
| Albion Joseph A | $85,000 | Redding Title Company |
Source: Public Records
Mortgage History
| Date | Status | Borrower | Loan Amount |
|---|---|---|---|
| Open | Gordon Alexander L | $131,900 | |
| Previous Owner | Albion Joseph A | $75,000 |
Source: Public Records
Tax History
| Year | Tax Paid | Tax Assessment Tax Assessment Total Assessment is a certain percentage of the fair market value that is determined by local assessors to be the total taxable value of land and additions on the property. | Land | Improvement |
|---|---|---|---|---|
| 2025 | $2,604 | $238,952 | $50,680 | $188,272 |
| 2024 | $2,568 | $234,268 | $49,687 | $184,581 |
| 2023 | $2,568 | $229,675 | $48,713 | $180,962 |
| 2022 | $2,495 | $225,172 | $47,758 | $177,414 |
| 2021 | $2,410 | $220,758 | $46,822 | $173,936 |
| 2020 | $2,400 | $218,495 | $46,342 | $172,153 |
| 2019 | $2,381 | $214,212 | $45,434 | $168,778 |
| 2018 | $2,353 | $210,013 | $44,544 | $165,469 |
| 2017 | $2,395 | $205,896 | $43,671 | $162,225 |
| 2016 | $2,164 | $201,860 | $42,815 | $159,045 |
| 2015 | $2,145 | $198,828 | $42,172 | $156,656 |
| 2014 | -- | $194,934 | $41,346 | $153,588 |
Source: Public Records
Map
Nearby Homes
- 3733 Capricorn Way
- 3688 Polaris Way
- 2427 Castlewood Dr
- 2332 Venus Way
- 3512 Capricorn Way
- 2498 Saturn Skyway
- 2704 Western Oak Dr
- 3792 Thomason Trail
- 2354 Suzette Ave
- 2068 Solar Way
- 3361 Alta Mesa Dr
- 3183 Agassi Ln
- 0 Shasta View Unit 25-1945
- 3030 Clear Water Ct
- 3685 Wimbledon Dr
- 2366 Templeton Dr
- 3341 Timbercreek Dr
- 3425 Silverwood St
- 3466 Silverwood St
- 2364 La Madre Ct
- 2544 Corona St
- 2572 Corona St
- 2557 Galaxy Way
- 2543 Galaxy Way
- 2571 Galaxy Way
- 2530 Corona St
- 2586 Corona St Unit Corona
- 2586 Corona St
- 2529 Galaxy Way
- 2585 Galaxy Way
- 2565 Corona St
- 3944 Capricorn Way Unit 1
- 3944 Capricorn Way
- 2551 Corona St
- 2516 Corona St
- 2517 Galaxy Way
- 2537 Corona St
- 3958 Capricorn Way
- 2523 Corona St
- 3925 Polaris Way
Your Personal Tour Guide
Ask me questions while you tour the home.