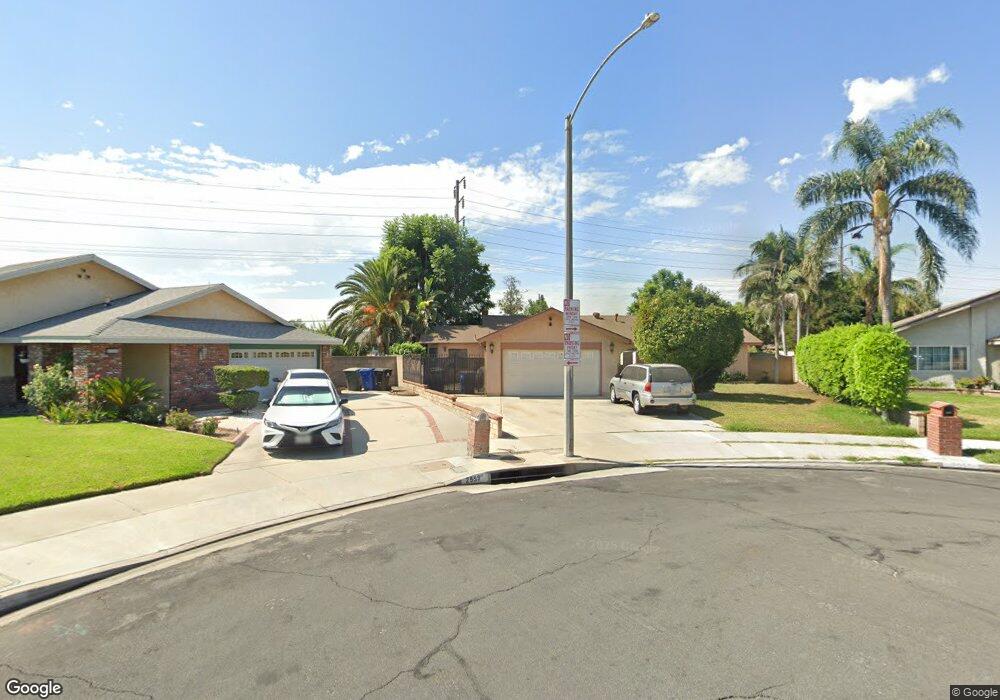
2558 S Concord Place Ontario, CA 91761
Downtown Ontario NeighborhoodEstimated Value: $702,713 - $744,000
4
Beds
2
Baths
1,636
Sq Ft
$445/Sq Ft
Est. Value
About This Home
This home is located at 2558 S Concord Place, Ontario, CA 91761 and is currently estimated at $728,428, approximately $445 per square foot. 2558 S Concord Place is a home located in San Bernardino County with nearby schools including Sultana Elementary School, De Anza Middle, and Ontario High School.
Ownership History
Date
Name
Owned For
Owner Type
Purchase Details
Closed on
Feb 21, 2011
Sold by
Tejada Angel
Bought by
Tejada Angel and Tejada Zoila
Current Estimated Value
Purchase Details
Closed on
Jun 25, 2003
Sold by
Tejada Zoila
Bought by
Tejeda Angel
Home Financials for this Owner
Home Financials are based on the most recent Mortgage that was taken out on this home.
Original Mortgage
$208,000
Outstanding Balance
$95,852
Interest Rate
6.5%
Mortgage Type
Purchase Money Mortgage
Estimated Equity
$632,576
Purchase Details
Closed on
Sep 4, 1996
Sold by
Lopez Patricia M
Bought by
Tejada Angel and Tejada Zoila
Home Financials for this Owner
Home Financials are based on the most recent Mortgage that was taken out on this home.
Original Mortgage
$50,000
Interest Rate
8.23%
Purchase Details
Closed on
Feb 27, 1996
Sold by
Texas Commerce Bank National Assn
Bought by
Tejada Angel and Tejada Zoila
Home Financials for this Owner
Home Financials are based on the most recent Mortgage that was taken out on this home.
Original Mortgage
$123,262
Interest Rate
6.98%
Mortgage Type
FHA
Purchase Details
Closed on
Oct 30, 1995
Sold by
Carillo Leo Alexander
Bought by
Texas Commerce Bank National Assn
Create a Home Valuation Report for This Property
The Home Valuation Report is an in-depth analysis detailing your home's value as well as a comparison with similar homes in the area
Home Values in the Area
Average Home Value in this Area
Purchase History
| Date | Buyer | Sale Price | Title Company |
|---|---|---|---|
| Tejada Angel | -- | None Available | |
| Tejeda Angel | -- | Southland Title | |
| Tejada Angel | -- | Mfi Title | |
| Tejada Angel | $124,000 | Fidelity National Title Ins | |
| Texas Commerce Bank National Assn | $125,000 | Stewart Title |
Source: Public Records
Mortgage History
| Date | Status | Borrower | Loan Amount |
|---|---|---|---|
| Open | Tejeda Angel | $208,000 | |
| Closed | Tejada Angel | $50,000 | |
| Previous Owner | Tejada Angel | $123,262 |
Source: Public Records
Tax History Compared to Growth
Tax History
| Year | Tax Paid | Tax Assessment Tax Assessment Total Assessment is a certain percentage of the fair market value that is determined by local assessors to be the total taxable value of land and additions on the property. | Land | Improvement |
|---|---|---|---|---|
| 2025 | $2,417 | $219,305 | $51,498 | $167,807 |
| 2024 | $2,417 | $215,005 | $50,488 | $164,517 |
| 2023 | $2,351 | $210,789 | $49,498 | $161,291 |
| 2022 | $2,321 | $206,655 | $48,527 | $158,128 |
| 2021 | $2,307 | $202,602 | $47,575 | $155,027 |
| 2020 | $2,267 | $200,524 | $47,087 | $153,437 |
| 2019 | $2,248 | $196,592 | $46,164 | $150,428 |
| 2018 | $2,218 | $192,737 | $45,259 | $147,478 |
| 2017 | $2,141 | $188,958 | $44,372 | $144,586 |
| 2016 | $2,058 | $185,253 | $43,502 | $141,751 |
| 2015 | $2,045 | $182,471 | $42,849 | $139,622 |
| 2014 | $1,984 | $178,897 | $42,010 | $136,887 |
Source: Public Records
Map
Nearby Homes
- 2300 S Sultana Ave Unit 298
- 310 E Philadelphia St
- 310 E Philadelphia St Unit 35
- 310 E Philadelphia St Unit SPC 102
- 320 W Walnut St Unit 6
- 2343 S Via Veranda Unit 10
- 2350 S Via Esplanade Unit 31
- 2333 S Via Esplanade Unit 25
- 209 W Via Rua Flores
- 12482 Silkleaf Ave
- 2408 S Taylor Place
- 12476 Park Ave
- 2127 S Monterey Ave
- 2890 S Via Belamaria
- 6763 Poinsettia Ct
- 2919 S Caldwell Ave
- 2119 S Phoenix Place
- 6703 Poinsettia Ct
- 6703 Aster Ct
- 926 E Skylark St
- 2552 S Concord Place
- 2559 S Concord Place
- 2546 S Concord Place
- 2553 Cherry Place
- 2553 S Concord Place
- 409 E Blue Jay Way
- 2603 S Cherry Ave
- 2547 S Concord Place
- 2559 Cherry Place
- 2540 S Concord Place
- 2547 Cherry Place
- 2541 S Concord Place
- 2609 S Cherry Ave
- 2541 Cherry Place
- 2558 S Sultana Ave
- 2552 S Sultana Ave
- 2534 S Concord Place
- 432 E Blue Jay Way
- 2546 S Sultana Ave
- 2535 S Concord Place