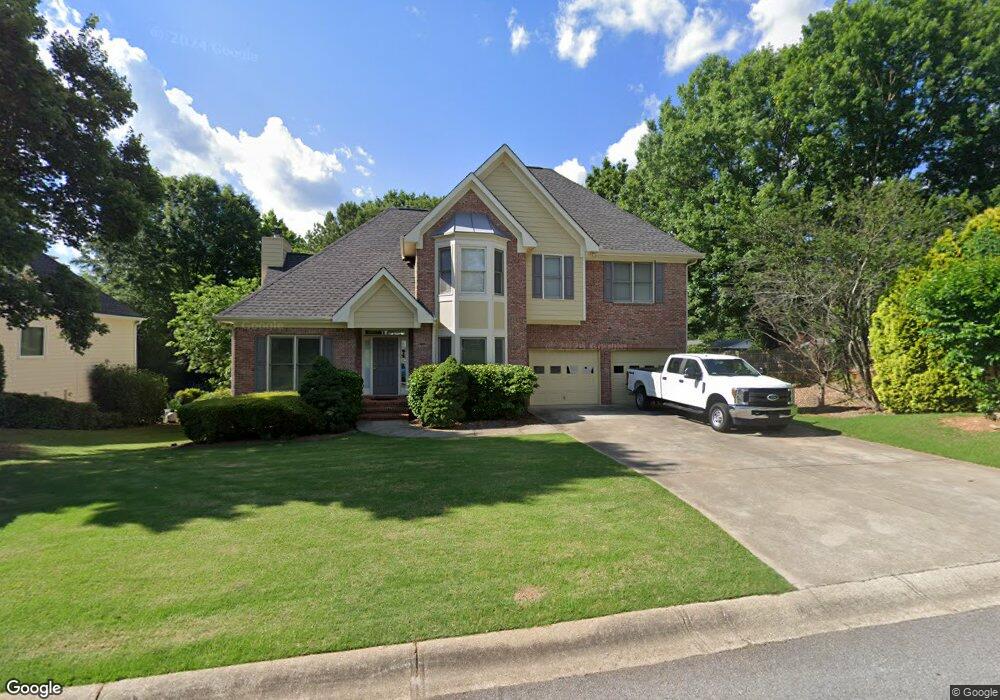
2559 Last Gap Trail Marietta, GA 30066
Sandy Plains NeighborhoodEstimated Value: $560,842 - $686,000
4
Beds
3
Baths
2,412
Sq Ft
$260/Sq Ft
Est. Value
About This Home
This home is located at 2559 Last Gap Trail, Marietta, GA 30066 and is currently estimated at $626,711, approximately $259 per square foot. 2559 Last Gap Trail is a home located in Cobb County with nearby schools including Rocky Mount Elementary School, Simpson Middle School, and Lassiter High School.
Ownership History
Date
Name
Owned For
Owner Type
Purchase Details
Closed on
Jul 12, 2002
Sold by
Choi Duk Ha and Jung Hwa
Bought by
Kao Ying-Yang
Current Estimated Value
Home Financials for this Owner
Home Financials are based on the most recent Mortgage that was taken out on this home.
Original Mortgage
$205,800
Interest Rate
6.67%
Mortgage Type
New Conventional
Purchase Details
Closed on
Nov 10, 1998
Sold by
Choi Jung Hwa
Bought by
Choi Duk Ha
Home Financials for this Owner
Home Financials are based on the most recent Mortgage that was taken out on this home.
Original Mortgage
$30,000
Interest Rate
6.84%
Mortgage Type
New Conventional
Purchase Details
Closed on
Oct 23, 1997
Sold by
Oakmont Properties Inc
Bought by
Choi Duk Ha and Choi Jung Hwa
Home Financials for this Owner
Home Financials are based on the most recent Mortgage that was taken out on this home.
Original Mortgage
$148,000
Interest Rate
7.39%
Mortgage Type
New Conventional
Create a Home Valuation Report for This Property
The Home Valuation Report is an in-depth analysis detailing your home's value as well as a comparison with similar homes in the area
Home Values in the Area
Average Home Value in this Area
Purchase History
| Date | Buyer | Sale Price | Title Company |
|---|---|---|---|
| Kao Ying-Yang | $257,300 | -- | |
| Choi Duk Ha | -- | -- | |
| Choi Duk Ha | $185,000 | -- |
Source: Public Records
Mortgage History
| Date | Status | Borrower | Loan Amount |
|---|---|---|---|
| Closed | Kao Ying-Yang | $205,800 | |
| Previous Owner | Choi Duk Ha | $30,000 | |
| Previous Owner | Choi Duk Ha | $148,000 |
Source: Public Records
Tax History Compared to Growth
Tax History
| Year | Tax Paid | Tax Assessment Tax Assessment Total Assessment is a certain percentage of the fair market value that is determined by local assessors to be the total taxable value of land and additions on the property. | Land | Improvement |
|---|---|---|---|---|
| 2025 | $5,893 | $195,584 | $39,600 | $155,984 |
| 2024 | $5,897 | $195,584 | $39,600 | $155,984 |
| 2023 | $5,897 | $195,584 | $39,600 | $155,984 |
| 2022 | $4,921 | $162,128 | $27,200 | $134,928 |
| 2021 | $4,921 | $162,128 | $27,200 | $134,928 |
| 2020 | $4,921 | $162,128 | $27,200 | $134,928 |
| 2019 | $4,723 | $155,624 | $34,000 | $121,624 |
| 2018 | $3,920 | $129,152 | $34,000 | $95,152 |
| 2017 | $3,713 | $129,152 | $34,000 | $95,152 |
| 2016 | $3,231 | $112,400 | $40,000 | $72,400 |
| 2015 | $3,311 | $112,400 | $40,000 | $72,400 |
| 2014 | $3,339 | $112,400 | $0 | $0 |
Source: Public Records
Map
Nearby Homes
- 3663 Heatherwood Dr NE
- 2477 Bobbie Dr
- 3851 Trickum Rd NE
- 2403 Wistful Way
- 2415 Wistful Way
- 3505 Bonaire Ct
- 3812 Havenrock Dr
- 3634 Stonehenge Way NE
- 3287 Allegheny Dr
- 3835 Rockhaven Ct
- 3816 Havenrock Dr
- 3150 Trickum Rd NE Unit LOT 1
- 3150 Trickum Rd NE
- 2591 Sandy Dr
- 2124 Lassiter Field Dr NE
- 2578 Middle Coray Cir
- 3844 Havenrock
- 4050 Idlewilde Meadows Dr NE
- 3122 Vandiver Dr
- 2555 Last Gap Trail
- 3626 Packhorse Run
- 3580 Trickum Rd NE
- 3630 Packhorse Run
- 3564 Trickum Rd NE
- 2558 Last Gap Trail
- 2562 Last Gap Trail
- 2554 Last Gap Trail
- 3594 Trickum Rd NE
- 3634 Packhorse Run
- 3618 Packhorse Run
- 3606 Trickum Rd NE
- 2674 Thornberry Place
- 3614 Packhorse Run
- 3633 Packhorse Run
- 3609 Trickum Rd NE
- 3625 Packhorse Run
- 3638 Packhorse Run
- 3621 Packhorse Run
- 2462 Sims Dr NE