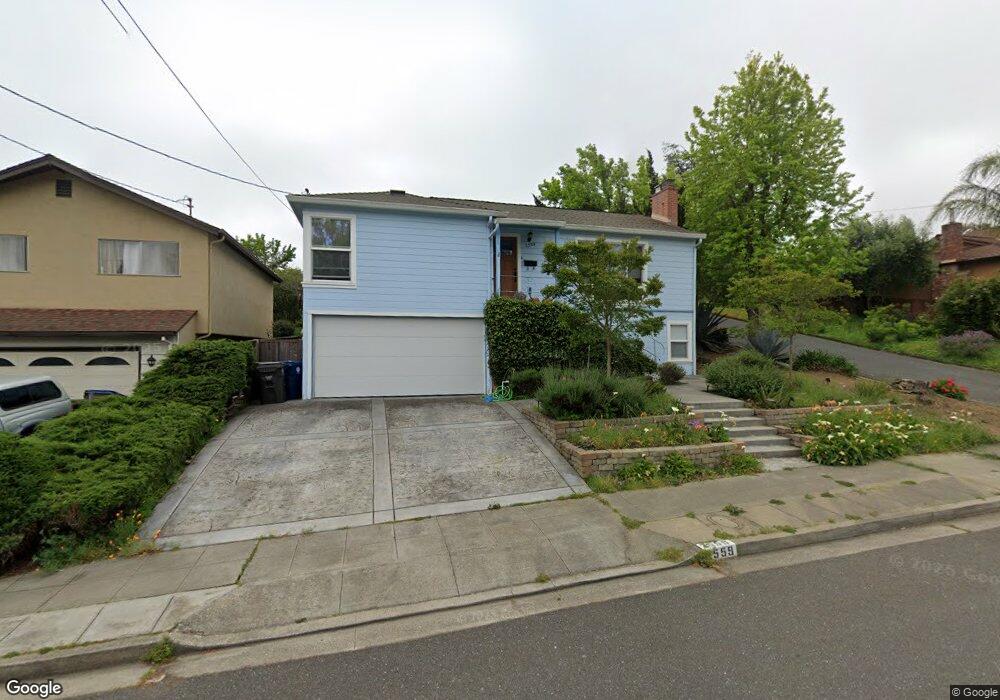
2559 Titan Way Castro Valley, CA 94546
West Castro Valley NeighborhoodEstimated Value: $1,025,391 - $1,215,000
4
Beds
2
Baths
1,856
Sq Ft
$600/Sq Ft
Est. Value
About This Home
This home is located at 2559 Titan Way, Castro Valley, CA 94546 and is currently estimated at $1,113,848, approximately $600 per square foot. 2559 Titan Way is a home located in Alameda County with nearby schools including Stanton Elementary School, Creekside Middle School, and Canyon Middle School.
Ownership History
Date
Name
Owned For
Owner Type
Purchase Details
Closed on
Sep 14, 2018
Sold by
Coburn Stephen E
Bought by
Coburn Stephen E and Stephen E Coburn Living Trust
Current Estimated Value
Purchase Details
Closed on
Aug 26, 2013
Sold by
Coburn Dawn L
Bought by
Coburn Stephen E
Home Financials for this Owner
Home Financials are based on the most recent Mortgage that was taken out on this home.
Original Mortgage
$360,000
Outstanding Balance
$268,218
Interest Rate
4.36%
Mortgage Type
New Conventional
Estimated Equity
$845,630
Purchase Details
Closed on
Aug 13, 1998
Sold by
Copeland David R and Copeland Susan D
Bought by
Coburn Stephen E and Coburn Dawn L
Home Financials for this Owner
Home Financials are based on the most recent Mortgage that was taken out on this home.
Original Mortgage
$220,450
Interest Rate
6.88%
Create a Home Valuation Report for This Property
The Home Valuation Report is an in-depth analysis detailing your home's value as well as a comparison with similar homes in the area
Home Values in the Area
Average Home Value in this Area
Purchase History
| Date | Buyer | Sale Price | Title Company |
|---|---|---|---|
| Coburn Stephen E | -- | None Available | |
| Coburn Stephen E | -- | North American Title Company | |
| Coburn Stephen E | $245,000 | North American Title Co |
Source: Public Records
Mortgage History
| Date | Status | Borrower | Loan Amount |
|---|---|---|---|
| Open | Coburn Stephen E | $360,000 | |
| Closed | Coburn Stephen E | $220,450 |
Source: Public Records
Tax History Compared to Growth
Tax History
| Year | Tax Paid | Tax Assessment Tax Assessment Total Assessment is a certain percentage of the fair market value that is determined by local assessors to be the total taxable value of land and additions on the property. | Land | Improvement |
|---|---|---|---|---|
| 2025 | $5,190 | $376,910 | $115,220 | $268,690 |
| 2024 | $5,190 | $369,383 | $112,961 | $263,422 |
| 2023 | $5,093 | $369,004 | $110,746 | $258,258 |
| 2022 | $4,983 | $354,770 | $108,575 | $253,195 |
| 2021 | $4,851 | $347,678 | $106,447 | $248,231 |
| 2020 | $4,738 | $351,041 | $105,355 | $245,686 |
| 2019 | $4,817 | $344,160 | $103,290 | $240,870 |
| 2018 | $4,679 | $337,413 | $101,265 | $236,148 |
| 2017 | $4,554 | $330,798 | $99,280 | $231,518 |
| 2016 | $4,332 | $324,312 | $97,333 | $226,979 |
| 2015 | $4,049 | $319,441 | $95,871 | $223,570 |
| 2014 | $3,986 | $313,185 | $93,994 | $219,191 |
Source: Public Records
Map
Nearby Homes
- 18675 Stanton Ave
- 18623 Laredo Rd
- 18760 Stanton Ave
- 2578 Ridge Crest Ct
- 16265 Lyle St
- 19100 Crest Ave Unit 30
- 19100 Crest Ave Unit 23
- 19100 Crest Ave Unit 100
- 18871 Stanton Ave
- 2812 Sydney Way
- 2317 Prosperity Way
- 2876 Eugene Terrace
- 2500 Miramar Ave Unit 203
- 2500 Miramar Ave Unit 101
- 3123 Huntington Ct
- 16274 San Remo Dr
- 16068 Gramercy Dr
- 16049 Selborne Dr
- 16085 Gramercy Dr
- 2250 Strang Ave
- 2567 Titan Way
- 18786 Titan Place
- 2531 Titan Way
- 18777 Cindy Way
- 18797 Cindy Way
- 18789 Titan Place
- 2523 Titan Way
- 18815 Cindy Way
- 18785 Titan Place
- 2548 Titan Way
- 2554 Titan Way
- 2536 Titan Way
- 2515 Titan Way
- 2568 Titan Way
- 18833 Cindy Way
- 18787 Titan Place
- 2572 Titan Way
- 2524 Titan Way
- 18778 Cindy Way
- 18760 Cindy Way