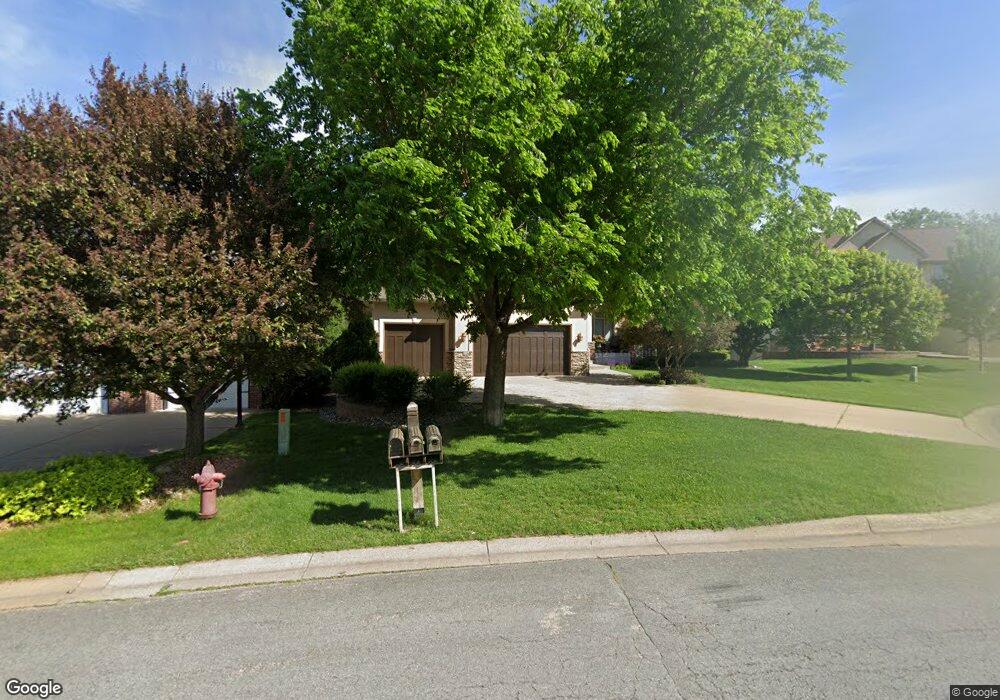
2559 Tournament Players Cir N Minneapolis, MN 55449
Estimated Value: $712,000 - $792,000
3
Beds
5
Baths
1,985
Sq Ft
$383/Sq Ft
Est. Value
About This Home
This home is located at 2559 Tournament Players Cir N, Minneapolis, MN 55449 and is currently estimated at $760,488, approximately $383 per square foot. 2559 Tournament Players Cir N is a home located in Anoka County with nearby schools including Northpoint Elementary School, Westwood Intermediate and Middle School, and Innovation Science & Tech Academy.
Ownership History
Date
Name
Owned For
Owner Type
Purchase Details
Closed on
Sep 21, 2018
Sold by
Thompson Timothy and Thompson Jacqueline A
Bought by
Thompson Timothy and Thompson Jacqueline A
Current Estimated Value
Purchase Details
Closed on
Jul 6, 2018
Sold by
Schoenberger Michael L and Schoenberger Daria
Bought by
Thompson Timothy
Home Financials for this Owner
Home Financials are based on the most recent Mortgage that was taken out on this home.
Original Mortgage
$430,000
Outstanding Balance
$260,182
Interest Rate
4.5%
Mortgage Type
New Conventional
Estimated Equity
$500,306
Purchase Details
Closed on
Mar 25, 2011
Sold by
Federal Home Loan Mortgage Corporation
Bought by
Schoenbenger Michael L
Purchase Details
Closed on
Dec 19, 2001
Sold by
Sienna Corp
Bought by
Gorham Builders Inc
Create a Home Valuation Report for This Property
The Home Valuation Report is an in-depth analysis detailing your home's value as well as a comparison with similar homes in the area
Home Values in the Area
Average Home Value in this Area
Purchase History
| Date | Buyer | Sale Price | Title Company |
|---|---|---|---|
| Thompson Timothy | -- | The Title Group Inc | |
| Thompson Timothy | $575,000 | Edina Reality Title Inc | |
| Schoenbenger Michael L | $410,000 | -- | |
| Gorham Builders Inc | $440,638 | -- |
Source: Public Records
Mortgage History
| Date | Status | Borrower | Loan Amount |
|---|---|---|---|
| Open | Thompson Timothy | $430,000 |
Source: Public Records
Tax History Compared to Growth
Tax History
| Year | Tax Paid | Tax Assessment Tax Assessment Total Assessment is a certain percentage of the fair market value that is determined by local assessors to be the total taxable value of land and additions on the property. | Land | Improvement |
|---|---|---|---|---|
| 2025 | $8,136 | $709,000 | $119,500 | $589,500 |
| 2024 | $8,136 | $686,800 | $109,500 | $577,300 |
| 2023 | $6,855 | $690,400 | $109,500 | $580,900 |
| 2022 | $7,275 | $649,000 | $89,600 | $559,400 |
| 2021 | $7,012 | $599,700 | $82,000 | $517,700 |
| 2020 | $7,053 | $571,400 | $81,900 | $489,500 |
| 2019 | $6,575 | $551,300 | $69,000 | $482,300 |
| 2018 | $6,569 | $507,400 | $0 | $0 |
| 2017 | $6,380 | $492,400 | $0 | $0 |
| 2016 | $6,341 | $456,300 | $0 | $0 |
| 2015 | $6,566 | $456,300 | $86,400 | $369,900 |
| 2014 | -- | $397,500 | $85,200 | $312,300 |
Source: Public Records
Map
Nearby Homes
- 2464 Tournament Players Cir N
- 2634 Tournament Players Cir N
- 11598 Yancy Ct NE
- 2535 110th Ct NE
- 11505 Palisade Ct NE
- 2915 Aspen Lake Dr NE
- 11064 Zumbrota Ct NE
- 11030 Amen Cir NE
- 2348 119th Cir NE
- 2255 119th Cir NE
- 2411 119th Ct NE Unit A
- 11880 Dunkirk Cir NE
- 11452 Knollwood Ct NE
- 10983 Dunkirk St NE
- 10837 Sanctuary Dr NE
- 12016 Vermillion St NE Unit D
- 2070 120th Ave NE
- 2638 Alamo Cir NE
- 3090 118th Ave NE
- 11508 Arnold Palmer Dr
- 2559 Tournament Players Ct S
- 2567 Tournament Players Ct S
- 2551 Tournament Players Ct S
- 2560 Tournament Players Ct S
- 2558 Tournament Players Ct S
- 2543 Tournament Players Ct S
- 2401 Tournament Players Cir S
- 2401 2401 Tournament Players Cir NE
- 2583 Tournament Players Cir S
- 2542 Tournament Players Ct S
- 2537 Tournament Players Ct S
- 2555 Tournament Players Cir S
- 2578 Tournament Players Cir S
- 2570 Tournament Players Cir S
- 2409 Tournament Players Cir S
- 2591 Tournament Players Cir S
- 2562 Tournament Players Cir S
- 2416 Tournament Players Cir S
- 2545 Tournament Players Cir S
- 2452 Tournament Players Cir N