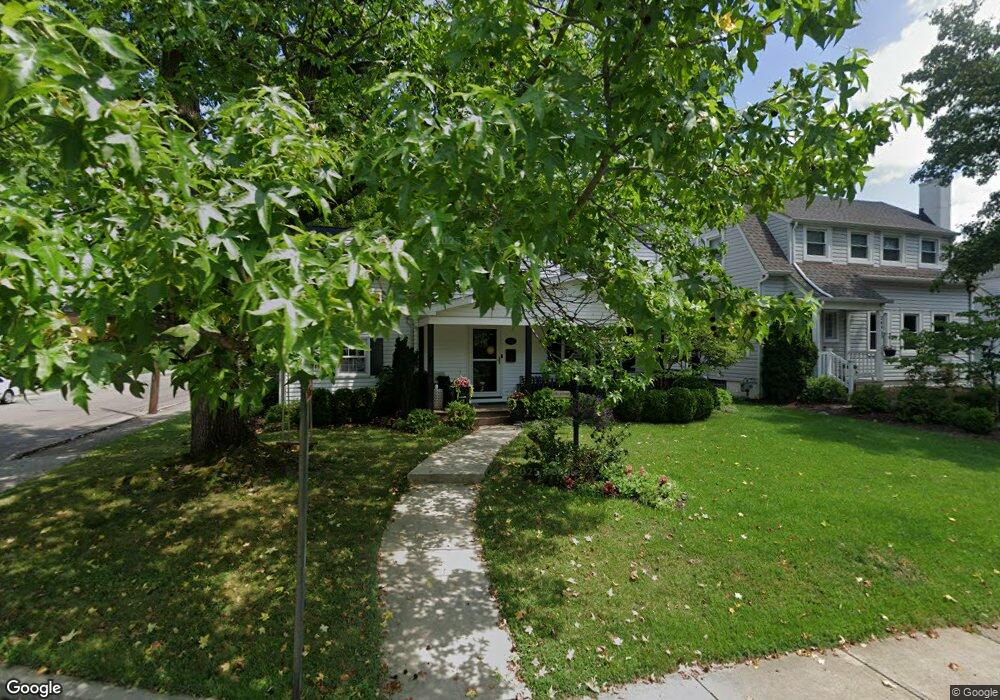
256 E Longview Ave Columbus, OH 43202
Clintonville NeighborhoodEstimated Value: $395,429 - $459,000
4
Beds
1
Bath
1,344
Sq Ft
$324/Sq Ft
Est. Value
About This Home
This home is located at 256 E Longview Ave, Columbus, OH 43202 and is currently estimated at $434,857, approximately $323 per square foot. 256 E Longview Ave is a home located in Franklin County with nearby schools including Clinton Elementary School, Dominion Middle School, and Whetstone High School.
Ownership History
Date
Name
Owned For
Owner Type
Purchase Details
Closed on
Dec 16, 2009
Sold by
Daniels Theresa and Jones Janet Louise
Bought by
Hageman Daniel J and Hageman Wende S
Current Estimated Value
Home Financials for this Owner
Home Financials are based on the most recent Mortgage that was taken out on this home.
Original Mortgage
$150,000
Outstanding Balance
$96,848
Interest Rate
5.02%
Mortgage Type
Purchase Money Mortgage
Estimated Equity
$338,009
Purchase Details
Closed on
Jun 7, 1967
Bought by
Starrett John N and Starrett Faye M
Create a Home Valuation Report for This Property
The Home Valuation Report is an in-depth analysis detailing your home's value as well as a comparison with similar homes in the area
Home Values in the Area
Average Home Value in this Area
Purchase History
| Date | Buyer | Sale Price | Title Company |
|---|---|---|---|
| Hageman Daniel J | $187,500 | Title First | |
| Starrett John N | -- | -- |
Source: Public Records
Mortgage History
| Date | Status | Borrower | Loan Amount |
|---|---|---|---|
| Open | Hageman Daniel J | $150,000 |
Source: Public Records
Tax History
| Year | Tax Paid | Tax Assessment Tax Assessment Total Assessment is a certain percentage of the fair market value that is determined by local assessors to be the total taxable value of land and additions on the property. | Land | Improvement |
|---|---|---|---|---|
| 2025 | $5,578 | $124,290 | $46,200 | $78,090 |
| 2024 | $5,578 | $124,290 | $46,200 | $78,090 |
| 2023 | $5,507 | $124,285 | $46,200 | $78,085 |
| 2022 | $6,207 | $119,670 | $35,140 | $84,530 |
| 2021 | $6,218 | $119,670 | $35,140 | $84,530 |
| 2020 | $6,205 | $119,280 | $35,140 | $84,140 |
| 2019 | $5,701 | $93,980 | $27,020 | $66,960 |
| 2018 | $4,648 | $92,160 | $27,020 | $65,140 |
| 2017 | $4,841 | $92,160 | $27,020 | $65,140 |
| 2016 | $4,095 | $61,820 | $23,280 | $38,540 |
| 2015 | $3,717 | $61,820 | $23,280 | $38,540 |
| 2014 | $3,727 | $61,820 | $23,280 | $38,540 |
| 2013 | $1,805 | $60,690 | $22,155 | $38,535 |
Source: Public Records
Map
Nearby Homes
- 270 Clinton Heights Ave
- 296 Walhalla Rd
- 83 Clinton Heights Ave
- 99 E Pacemont Rd
- 45 E California Ave
- 107 E Dunedin Rd
- 44 W Pacemont Rd
- 589 Clinton Heights Ave
- 467 Brevoort Rd
- 3021 N High St
- 84-86 W Como Ave
- 27 E Dunedin Rd
- 544 Piedmont Rd
- 123 W Como Ave
- 94 W Tulane Rd
- 30 E Torrence Rd
- 555 E Weber Rd
- 2836-2838 Indianola Ave Unit 2836
- 53 Olentangy St
- 2785 Kensington Place W
- 264 E Longview Ave
- 270 E Longview Ave
- 3251 Calumet St
- 238 E Longview Ave Unit 240
- 265 Clinton Heights Ave
- 278 E Longview Ave
- 273 Clinton Heights Ave
- 255 E Longview Ave
- 259 E Longview Ave
- 279 Clinton Heights Ave
- 243 E Longview Ave
- 232 E Longview Ave Unit 234
- 267 E Longview Ave
- 247 Clinton Heights Ave
- 237 E Longview Ave
- 285 Clinton Heights Ave
- 286 E Longview Ave
- 275 E Longview Ave
- 226 E Longview Ave
- 229 E Longview Ave
Your Personal Tour Guide
Ask me questions while you tour the home.