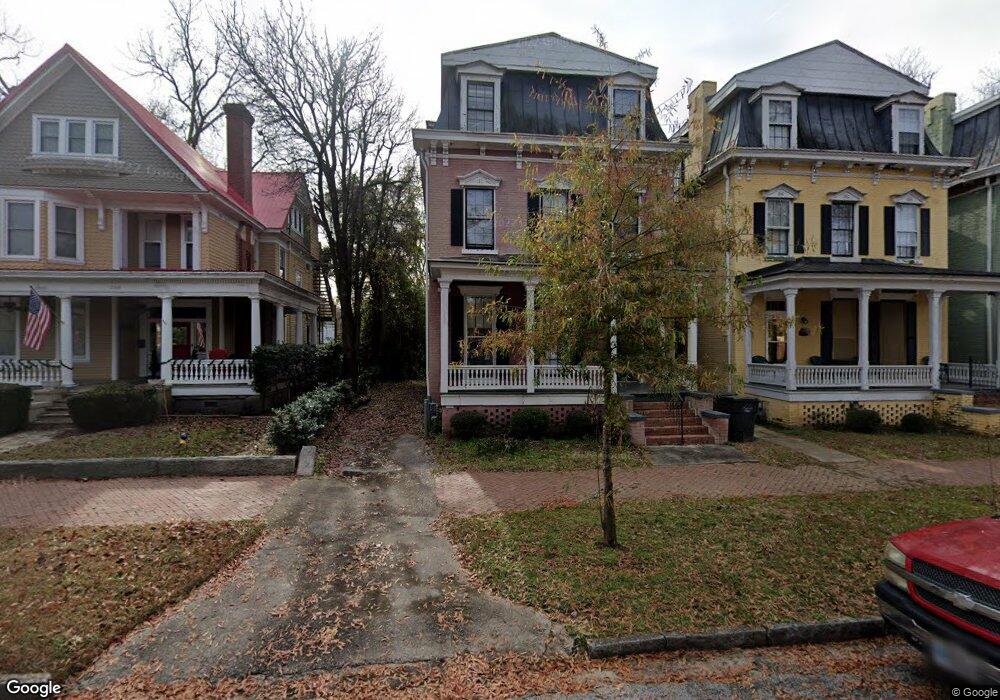
256 Greene St Unit B Augusta, GA 30901
Olde Town-Pinched Gut NeighborhoodEstimated Value: $406,000
2
Beds
1
Bath
2,855
Sq Ft
$142/Sq Ft
Est. Value
About This Home
This home is located at 256 Greene St Unit B, Augusta, GA 30901 and is currently estimated at $406,000, approximately $142 per square foot. 256 Greene St Unit B is a home located in Richmond County with nearby schools including W.S. Hornsby School, W.S. Hornsby Elementary School, and Johnson Magnet.
Ownership History
Date
Name
Owned For
Owner Type
Purchase Details
Closed on
Feb 21, 2017
Sold by
Not Provided
Bought by
Olde Town Augusta Llc
Current Estimated Value
Create a Home Valuation Report for This Property
The Home Valuation Report is an in-depth analysis detailing your home's value as well as a comparison with similar homes in the area
Home Values in the Area
Average Home Value in this Area
Purchase History
| Date | Buyer | Sale Price | Title Company |
|---|---|---|---|
| Olde Town Augusta Llc | $767,000 | -- |
Source: Public Records
Tax History Compared to Growth
Tax History
| Year | Tax Paid | Tax Assessment Tax Assessment Total Assessment is a certain percentage of the fair market value that is determined by local assessors to be the total taxable value of land and additions on the property. | Land | Improvement |
|---|---|---|---|---|
| 2025 | $6,833 | $200,152 | $2,310 | $197,842 |
| 2024 | $6,833 | $184,446 | $2,310 | $182,136 |
| 2023 | $1,251 | $18,386 | $2,310 | $16,076 |
| 2022 | $1,197 | $15,322 | $2,310 | $13,012 |
| 2021 | $3,108 | $39,782 | $2,310 | $37,472 |
| 2020 | $1,080 | $10,640 | $554 | $10,086 |
| 2019 | $2,065 | $44,400 | $2,310 | $42,090 |
| 2018 | $1,051 | $44,400 | $2,310 | $42,090 |
| 2017 | $2,198 | $44,400 | $2,310 | $42,090 |
| 2016 | $2,199 | $44,400 | $2,310 | $42,090 |
| 2015 | $2,211 | $44,400 | $2,310 | $42,090 |
| 2014 | $3,454 | $44,400 | $2,310 | $42,090 |
Source: Public Records
Map
Nearby Homes