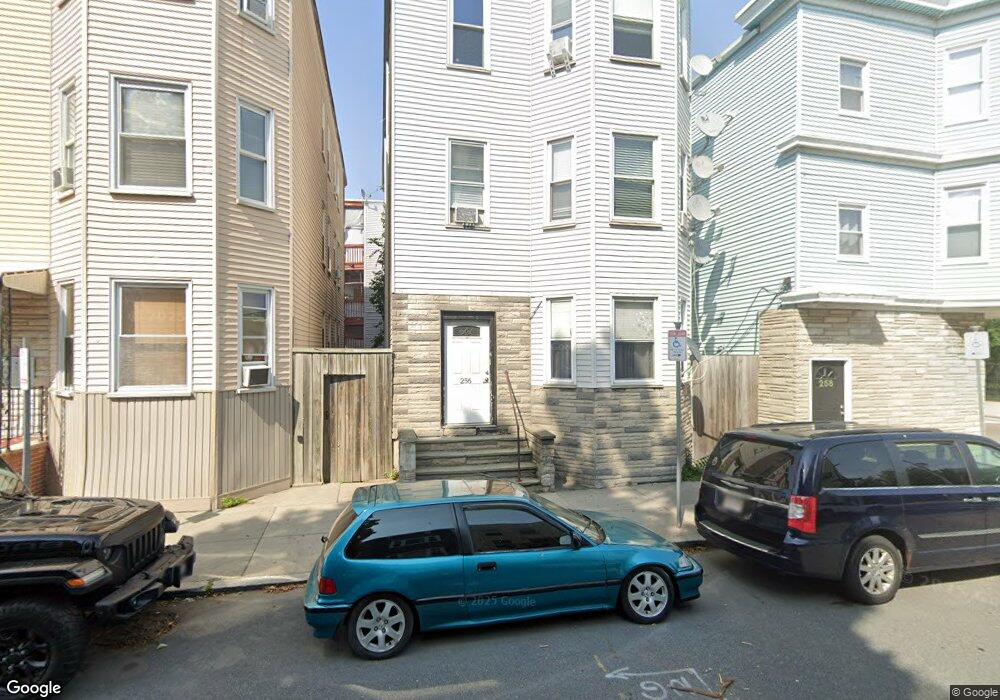
256 Marion St Unit A Boston, MA 02128
Jeffries Point NeighborhoodEstimated Value: $297,000 - $530,000
2
Beds
1
Bath
730
Sq Ft
$545/Sq Ft
Est. Value
About This Home
This home is located at 256 Marion St Unit A, Boston, MA 02128 and is currently estimated at $397,507, approximately $544 per square foot. 256 Marion St Unit A is a home located in Suffolk County with nearby schools including East Boston Central Catholic School.
Ownership History
Date
Name
Owned For
Owner Type
Purchase Details
Closed on
Mar 5, 2012
Sold by
Lilypad Props Llc
Bought by
Lionsgate Props Llc
Current Estimated Value
Home Financials for this Owner
Home Financials are based on the most recent Mortgage that was taken out on this home.
Original Mortgage
$90,000
Outstanding Balance
$60,955
Interest Rate
3.88%
Mortgage Type
New Conventional
Estimated Equity
$336,552
Purchase Details
Closed on
Aug 13, 2009
Sold by
Braccia Richard
Bought by
Lilypad Prop Llc
Purchase Details
Closed on
Jan 10, 2008
Sold by
Dagostin Luis
Bought by
Pereira Jucenaldo
Home Financials for this Owner
Home Financials are based on the most recent Mortgage that was taken out on this home.
Original Mortgage
$279,000
Interest Rate
6.21%
Mortgage Type
Purchase Money Mortgage
Purchase Details
Closed on
Dec 5, 2007
Sold by
Mendoza Carlos
Bought by
Dagostin Luis F
Home Financials for this Owner
Home Financials are based on the most recent Mortgage that was taken out on this home.
Original Mortgage
$279,000
Interest Rate
6.21%
Mortgage Type
Purchase Money Mortgage
Create a Home Valuation Report for This Property
The Home Valuation Report is an in-depth analysis detailing your home's value as well as a comparison with similar homes in the area
Home Values in the Area
Average Home Value in this Area
Purchase History
| Date | Buyer | Sale Price | Title Company |
|---|---|---|---|
| Lionsgate Props Llc | $80,000 | -- | |
| Lilypad Prop Llc | -- | -- | |
| Braccia Richard | $41,000 | -- | |
| Pereira Jucenaldo | $310,000 | -- | |
| Dagostin Luis F | -- | -- |
Source: Public Records
Mortgage History
| Date | Status | Borrower | Loan Amount |
|---|---|---|---|
| Open | Lionsgate Props Llc | $90,000 | |
| Previous Owner | Pereira Jucenaldo | $279,000 |
Source: Public Records
Tax History
| Year | Tax Paid | Tax Assessment Tax Assessment Total Assessment is a certain percentage of the fair market value that is determined by local assessors to be the total taxable value of land and additions on the property. | Land | Improvement |
|---|---|---|---|---|
| 2025 | $3,330 | $287,600 | $0 | $287,600 |
| 2024 | $3,169 | $290,700 | $0 | $290,700 |
| 2023 | $3,090 | $287,700 | $0 | $287,700 |
| 2022 | $3,038 | $279,200 | $0 | $279,200 |
| 2021 | $2,921 | $273,800 | $0 | $273,800 |
| 2020 | $2,274 | $215,300 | $0 | $215,300 |
| 2019 | $2,102 | $199,400 | $0 | $199,400 |
| 2018 | $1,866 | $178,100 | $0 | $178,100 |
| 2017 | $1,715 | $161,900 | $0 | $161,900 |
| 2016 | $1,664 | $151,300 | $0 | $151,300 |
| 2015 | $1,620 | $133,800 | $0 | $133,800 |
| 2014 | $1,570 | $124,800 | $0 | $124,800 |
Source: Public Records
Map
Nearby Homes
- 246 Bremen St Unit 3
- 204 Marion St Unit 5
- 40 Morris St Unit 2
- 198 Marion St
- 197 Havre St Unit 2
- 100 Bennington St Unit 1
- 187 London St Unit 1
- 152 Marion St Unit 6
- 289 Chelsea St
- 120 Bremen St Unit 3
- 219 Saratoga St Unit 2
- 152 Saratoga St
- 135 Havre St Unit 2
- 64 Frankfort St Unit 6
- 160 London St Unit 3
- 160 London St Unit 4
- 160 London St Unit 2
- 160 London St Unit 1
- 71 Lubec St Unit 1
- 125 Princeton St Unit 3
- 256 Marion St Unit C
- 256 Marion St Unit B
- 256 Marion St Unit 3
- 258 Marion St
- 258 Marion St
- 258 Marion St Unit 1
- 254 Marion St
- 236 Bremen St
- 252 Marion St Unit 3
- 252 Marion St
- 252 Marion St Unit 2
- 238 Bremen St
- 238 Bremen St
- 238 Bremen St Unit 3
- 238 Bremen St Unit 2
- 238 Bremen St Unit 1
- 197 Chelsea St
- 199 Chelsea St
- 201 Chelsea St
- 203 Chelsea St
Your Personal Tour Guide
Ask me questions while you tour the home.